Is The Stock Market Starting A New Bull Market Rally?
It has been a while since I have written a simple technical analysis article. My focus has been on helping teach others how the markets move and to trade and invest differently, so I apologize for the lack of chart analysis over the past several months.
With that said, the market could be starting something big and exciting, which brings new opportunities, and, eventually, some massive risk for investors. I cover my outlook in much greater depth in this screen share video I did with Craig Hemke.
As an active trader relying solely on technical analysis and risk and position management, the recent rebound in major stock indexes is an encouraging sign. The past month had been weak and was starting to spook average market participants.
We watched the masses panic out of positions last week and bought put options, betting heavily for a collapse on Thursday and Friday, but the opposite happened, as expected. I feel bad for these suckers who trade purely on emotional impulse. They take beating after beating until they give in and decide to learn how the markets move and manage positions and risk or give up on trading.
Anyways, onward and upward!
Buyers have stepped in and are supporting prices, and these rebounds are occurring at important moving average lines. I’m paying close attention to the 200-day moving average lines on the major indexes.
This is significant because no matter how good of a trader you are, if you don’t know short-term and long-term trends of the broad stock market, your odds of consistently winning trades and growing your account drop to about 30%. With that said, let’s jump into some charts!
Dow Industrials Daily Chart
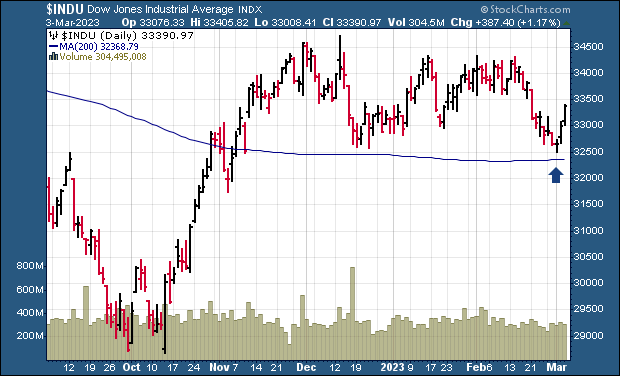
Looking at the Dow Industrials Chart, it’s bounced off potential support along its late December low and its 200-day moving average. This is a positive sign, as it keeps the sideways trading range intact.
It’s also to keep in mind that the longer a chart trades sideways, the larger the next breakout should be. This three-month pause could pack a powerful punch/rally if the market continues this move.
S&P 500 Daily Chart
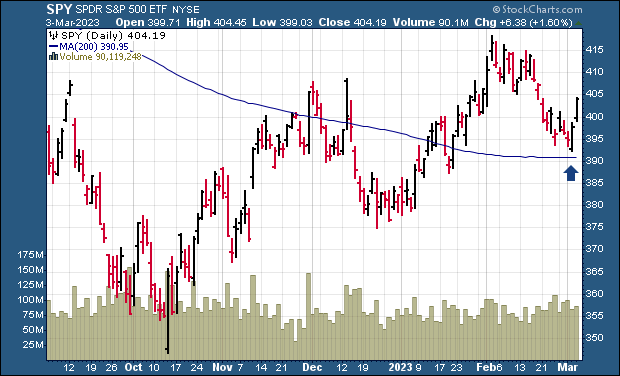
The S&P 500 looks to have found support and started a reversal from its 200-day line on Thursday and gained more ground on Friday.
Nasdaq 100 QQQ Daily Chart
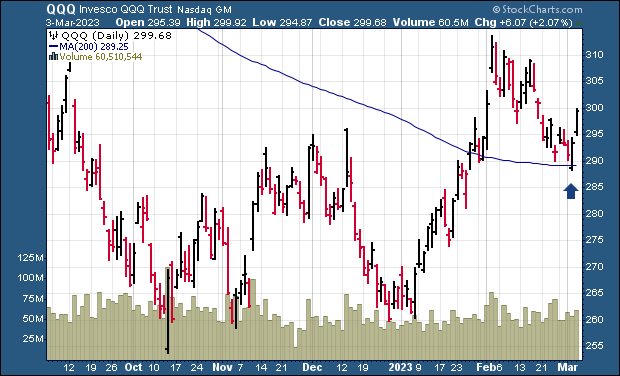
The Invesco QQQ ETF has also bounced off its 200-day average, indicating that there’s strong support at this level.
Small Cap IWM Daily Chart
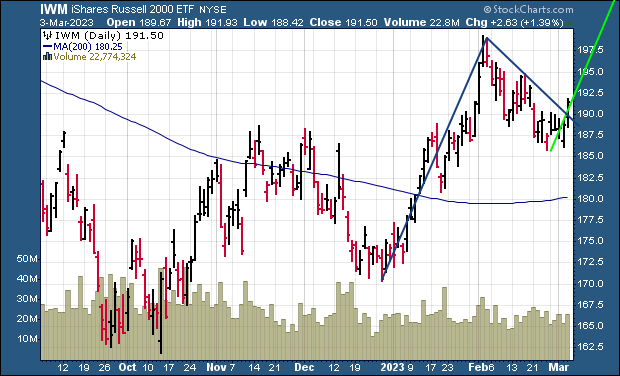
As a technical trader, I’m always looking for signs of strength and weakness in the market, and small-cap stocks have been standing out as a particularly strong area of the market in recent months. Despite the overall weakness in the markets in February, small-cap stocks have held up better than their larger counterparts, which is a promising sign.
I can see that the Russell 2000 iShares is well above its 200-day moving average, which is an important level of support. This indicates that there’s still a strong bullish sentiment in the small-cap space.
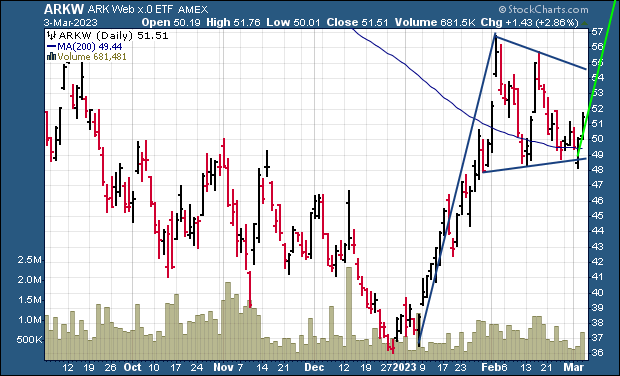
ARKW Daily Chart (Momentum & Growth Stocks)
It’s worth noting that small-cap and growth stock leadership is typically a positive sign for the broader market, as these stocks tend to lead the way during market rallies. As a technical trader, I’m encouraged by the strength of these stocks and will continue to monitor this market area for potential trading opportunities closely. I also feel that gold, silver, and miners could come back to life.
Earlier in February, subscribers and I locked in gains with ARKW at 7% and 15% gains. We also locked in 7% in SMH and 10% with QLD. Another big rally in these types of stocks could be starting once more, which I plan to take advantage of using my Best Asset Now (BAN) ETF strategy.
Concluding Thoughts:
In short, last week, the market may have turned a major corner that could last a few months. I feel it will catch a tone of traders off guard, and then, once this move is complete, the following move will destroy most investors’ accounts and retirement dreams, but we can talk about that another time. It’s a little way away still.
Overall, the market remains in what I call a Stage 3 topping phase, and the key is to protect our capital and not be swinging for the fences until the next tradable stage starts, which would be Stage 2 or Stage 4.
In large part, long-term investors have been brainwashed, and as a result, they struggle to break free of the financial strategies that we were all told to follow since saving the first penny. Know How Asset Revesting helps to invest for growth without having a large downside risk.
Chris Vermeulen
Chief Investment Officer
www.TheTechnicalTraders.com
Disclaimer: This and any information contained herein should not be considered investment advice. Technical Traders Ltd. and its staff are not registered investment advisors. Under no circumstances should any content from websites, articles, videos, seminars, books or emails from Technical Traders Ltd. or its affiliates be used or interpreted as a recommendation to buy or sell any security or commodity contract. Our advice is not tailored to the needs of any subscriber so talk with your investment advisor before making trading decisions. Invest at your own risk. I may or may not have positions in any security mentioned at any time and maybe buy sell or hold said security at any time.

