How To Tell If The Stock Market Is Bullish Or Bearish
Astute market observers understand that the economic and stock market cycles are related but not the same. The stock market has a cycle that tends to lead or lag the economic cycle.
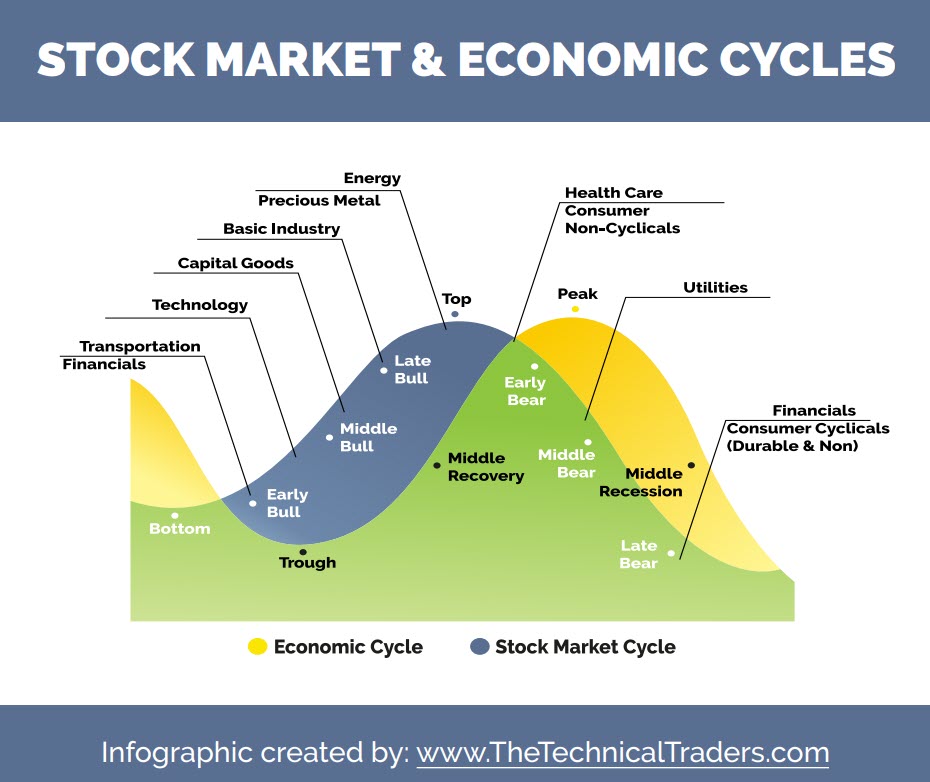
In the diagram below, you can see which sectors and commodities generally perform better or worst during different times within the stock and economic cycles.
While the economy’s health is measured with lagging indicators, the stock market is forward-looking. Stock investors don’t focus on where the economy has been but on where they think it is going in the coming months. Economists read the latest economic reports of lagging data. Stock investors attempt to read the economic “tea leaves” for clues about future direction.
Strong Economy, Strong Market
A strong economy is easy to identify. Corporate earnings are strong, growing businesses are expanding, and new ones are being created. Unemployment is low, even to the point where many job openings go unfilled for lack of qualified or willing candidates. Incomes are rising, and consumer spending is strong. Housing is robust, with lots of new construction starts and price appreciation. Energy and other commodity prices tend to be increasing due to strong demand.
In a strong economy, stocks have a bullish trend with occasional pullbacks within that trend. Every dip can be bought, and penalties for doing so are the exception rather than the rule. More speculative stocks tend to do well as investors try to place capital ahead of future growth industries, which is one of the trading strategies we focus on using the BAN – Best Asset Now newsletter.
Mixed Signals, Economy Contracting
Economic conditions eventually weaken for any number of reasons. It could be a speculative bubble that has just gone too far. It could be an overdue financial reckoning from the over-expansion of credit. Or perhaps a once-in-a-century pandemic that leads to a drastic slowdown in economic activity. We’ve seen all these conditions in recent decades.
Stocks tend to continue higher in a bull market even as leading indicators start to show weakness. Investors that step in to “buy the dip” are wrong with increasing frequency. Capital tends to rotate to more defensive sectors, and asset classes like the US dollar and commodities as cracks form in investors’ recency bias – thus, volatility increases. Eventually, the bull market inertia in stocks fades as it sinks in with investors that the economic indicators are deteriorating and likely to worsen. This is when stocks can appear both bullish or bearish day to day and sector by sector, confusing and frustrating investors.
If you want to learn more about how to see the markets clearer and to control your emotions, we put together a killer article to learn how your brain sees and perceives the markets and news.
A follower of our work said something along these lines about this article:
This is the wisest investment advice I have read out of the hundreds or thousands of newsletters I have read.
Read This article
Central Bank Stimulating Mode
In a “typical” deteriorating economy, central banks like the Fed will step in at some point to stimulate the economy back to health by reducing the cost of capital with lower interest rates, also referred to as Quantitative Easing.
An optional part of this monetary policy is for the Fed to purchase distressed assets. In an extreme economic stumble, governments may step in with fiscal policy measures like direct stimulus and institutional bailouts. Eventually, the economy recovers. But there is also the risk of overstimulating the economy.
Central Bank Inflation Fighting Mode
When the economy is running “too hot,” high demand is chasing too little supply. And that, of course, leads to inflation in the prices of goods and services. At some point, the Fed will step in by raising interest rates as part of a Quantitative Tightening program. A strong US dollar and higher Treasury yields go along with higher target rates from the Fed.
The strong Dollar makes US exports and commodities priced in USD more expensive for the rest of the world. That affects inflation in other countries and makes for greater challenges for their central banks. A strong US dollar also dampens US exports and the profits of multinational companies.
In this phase, there is the risk of central banks overshooting in their fight against inflation, but the good news is that we can take advantage of these shifts using ETFs and the CGS strategy.
Mixed Signals, Economy Bottoming Out
Why is it so difficult to tell if a weak economy is bottoming out? Mixed signals. Some metrics are still declining, while others are improving.
When stocks have been bearish and are well off their highs, investors look for signs that they can put capital to work again in the stock market. This is another time when stock trends can flip and flop direction daily.
Sign up for my free trading newsletter, so you don’t miss the next opportunity!
Clear Signals
Clear signs of an economic recovery include a peak in inflation data and more dovish language coming out of the Fed, suggesting that the pace of interest rate increases will slow or even reverse. Signs that inflation has peaked include:
- Declining Consumer Price Index (CPI) numbers.
- Declining wage costs.
- Declining consumer spending.
- Falling Treasury yields.
- Improving bond prices.
By the time we see clear signals that an economic trough has bottomed, the stock market is likely already far out in front. Lingering bad news like disappointing earnings reports is more easily dismissed as investors focus on the outlook. Investors are anticipating a recovery that hasn’t fully formed yet, but they are ready to stick their toes back in the water.
When the signals are still mixed in a soft economy, investors again ask, “Is the stock market bullish or bearish?”. The surest answer in such a period of uncertainty is “Yes.”
What To Learn More About Options Trading?
Every day on Options Trading Signals, we do defined risk trades that protect us from black swan events 24/7. Many may think that is what stop losses are for. Well, remember the markets are only open about 1/3 of the hours in a day. Therefore, a stop loss only protects you for 1/3 of each day. Stocks can gap up or down. With options, you are always protected because we do defined risk in a spread. We cover with multiple legs, which are always on once you own.
If you are new to trading or have been trading stock but are interested in options, you can find more information at The Technical Traders – Options Trading Signals Service. Brian, who has been trading options for almost 20 years, sends out real live trade alerts on actual trades, such as TSLA and NVDA, with real money. Ready to subscribe, click here: TheTechnicalTraders.com.
Enjoy your day!
Brian Benson
Chief Options Strategist
TheTechnicalTraders.com
Disclaimer: This email and any information contained herein should not be considered investment advice. Technical Traders Ltd. and its staff are not registered investment advisors. Under no circumstances should any content from websites, articles, videos, seminars, books or emails from Technical Traders Ltd. or its affiliates be used or interpreted as a recommendation to buy or sell any security or commodity contract. Our advice is not tailored to the needs of any subscriber so talk with your investment advisor before making trading decisions. Invest at your own risk. I may or may not have positions in any security mentioned at any time and maybe buy sell or hold said security at any time.