US Dollar Has A Lot Of Upside Potential – Part III
- Presidential election cycles drive US Dollar trends.
- US Dollar expected to rise before the election and then stall right before the day of the election.
- Money will start shifting away from the stock market now, and traders will likely target safe-haven investments and undervalued traditional investments (dividends, blue chips, utilities, energy, bonds, consumer service and supplies, and possibly technology suppliers) going forward.
- The potential for a US Dollar upside price rally after the elections (just like the 2013~2014 setup) is a very valid expectation from a technical analysis perspective.
This is the final part of our three-part US Dollar research article. My research team’s belief is that the US Dollar will recover in value before the US Presidential Election, then stall right before the election date as traders attempt to digest the outcome of the election. In this final part of our research article, we’re going to share insights and technical analysis setups that we believe support our predictions on the US Dollar. Please take a minute to review Part I and Part II of this research series if you have missed any portion of it.
Our research team has highlighted a price pattern in the US Dollar that seems to be fairly consistent over the past 8+ years. This pattern suggests the US Dollar will move higher over the next 60+ days, which may likely correlate with the US stock market stalling and/or moving lower. Just prior to the November 3, 2020 election date, the US Dollar should stall as global traders and investors await the results. After the election is complete, then we watch the scramble as global traders and investors attempt to reposition assets to take advantage of perceived opportunities.
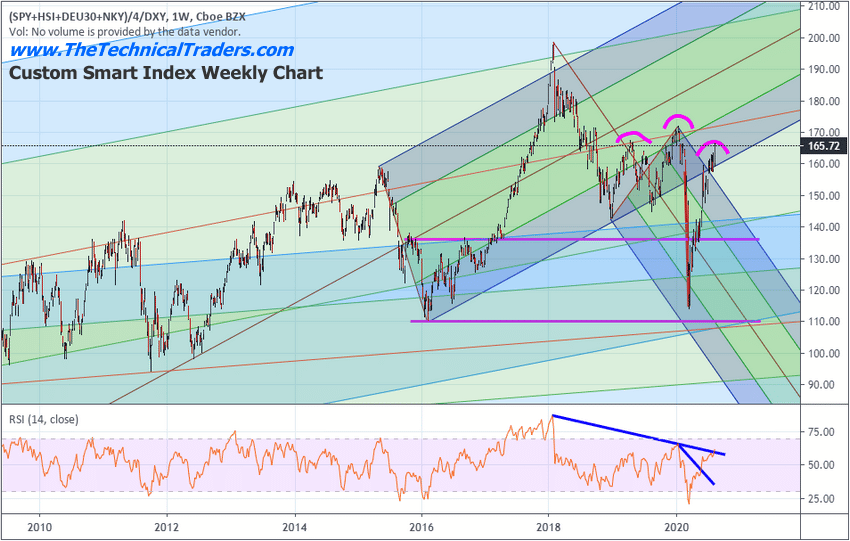
CUSTOM SMART MONEY SETTING UP A HEAD-AND-SHOULDERS TOP
We are going to start by reviewing our Custom Smart Money Index Weekly chart, below. This Smart Money Index chart highlights the triple-top pattern that appears to be setting up after the COVID-19 collapse. We find this important because the “true smart money peak” in the US stock market occurred near the peak in January/February 2018. Therefore, our researchers believe the true organic growth peak in the US and global markets occurred well over 2 years ago – not throughout the new price peaks we’ve experienced in the US markets after the COVID-19 collapse. Those, secondary price peaks, were speculative peaks – not organic economic growth peaks. And speculative peaks tend to end in explosive contraction events.
Without getting into politics, policies or other aspects of the 2020 US Presidential Election, there are only 60+ days left for skilled traders and investors to prepare for either a Trump or Biden Presidency. Each candidate has outlined numerous objectives, tax policies and spending plans. All of the translates into how consumers and businesses plan for and prepare to operate within these potentially new economic constructs. When you stop and think about the potential differences between a Trump second term and a new Biden term – the stakes for investors and traders are much higher than many expect.
Because of this high-stake US Presidential election, we believe global traders and investors will begin to move assets away from the high-flying US stock market and away from excessive risks. Traders will instead likely target safe-haven investments and undervalued traditional investments (dividends, blue chips, utilities, energy, bonds, consumer service and supplies and possibly technology suppliers) going forward.
Be sure to sign up for our free market trend analysis and signals now so you don’t miss our next special report!
My research team believes the transition away from the high-flying technology sectors and S&P sectors will be a move into protection – away from risks relating to a potential collapse in the US stock market. We believe the triple-top in our Custom Smart Cash Index clearly illustrates how the US and global stock market is functioning – even though the price charts for the NASDAQ and S&P 500 charts show moderately higher price levels. This Custom Smart Cash Index shows a clear Head-and-Shoulders pattern setting up – which is a strong indication that another decline in price levels may be in our immediate future.
COMPARISON CURRENCY ANALYSIS SHOWS US DOLLAR MAY RALLY 5% OR MORE
This comparison chart, below, comparing the Asian currencies and the US/Western currencies highlights another technical pattern that we believe substantiates a potential US Dollar rally over the next 60+ days. The Custom Asian to US/Western currency index chart is the Candlestick price chart while the US Dollar Index is shown on this chart as the BLUE LINE on this chart. What we want you to focus on is how the Asian to US/Western index tends to parallel the US Dollar Index more than 80% of the time on this chart. Yet, we also want you to focus on the times when the US Dollar Index (the BLUE LINE) varies away from the Custom Index price levels. We found this very interesting as the US Dollar Index tends to react in ways that leads and lags the price correlation of the Custom Index.
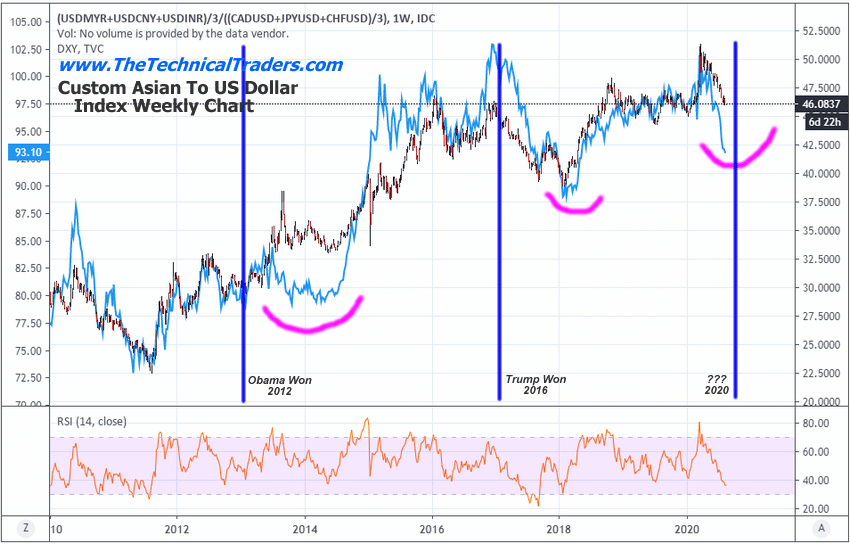
We also believe the current extreme low price level in the US Dollar Index is similar to the 2013~14 area on this chart – where the US Dollar was pushed lower because the US stock market continued to rally to new highs and traders/investors concerns were the “fear of missing out” of the rally. When this happens, global traders pile into the US stock market and ignore the US Dollar. Who cares that the US Dollar lost 3% to 4% of value when the US Stock market just rallied 13% to 20% over the past 16+ months.
Yet, the minute the US stock market enters a period of consolidation, sideways trading and concern, then everyone suddenly cares what’s happening with global currencies and the US Dollar because 8% to 15%+ rotations in the stock market while the US Dollar is falling 3% to 5% or more can really hurt foreign investors.
We believe the current setup on the right side of this Asian to US/Western currency correlation chart is very similar to what happened in late 2013 – where the correlation price index rose to a peak near 38 – then stalled into a narrow sideways channel. The US Dollar Index collapsed throughout this span of time and then suddenly started to gain in value in late 2014 – right near the peak in the markets before the 2015/2016 US stock market (which also correlated with the start of the 2016 Presidential Election campaigns). Imagine what would happen if a similar rally in the US Dollar took place after the 2020 elections and how that will reflect as global investors pile into the US markets with a stronger US Dollar.
As technical traders, we attempt to identify and analyze these types of technical patterns as well as price patterns and other advance price theory. Our job is to try to find hidden, often somewhat secret, correlations in price, technical patterns, seasonal patterns or cross-market trends so our members can profit from these setups. When we’re right, we try to take advantage of these setups and alert our members to the trade setups as they happen. When we’re wrong, we take our losses – just like everyone else.
We believe this setup in the US Dollar Index could be a very valid technical price trigger that could prompt a big rally in the US Dollar and US Stock market. We believe the rally in the US stock market may start to to really shape up in late 2021. Yet, everything depends on what happens over the next 90+ days and how the US elections turn out. This year, the one thing we’re not going to try to predict is the results of the US Presidential elections – that’s not our specialty. We do believe the potential for a US Dollar upside price rally after the elections (just like the 2013~2014 setup) is a very valid expectation.
Either way, we’re going to be here to help you find these incredible setups and great trades. Think about how a big rally in the US Dollar will result in a massive influx of capital from foreign investors and institutions. It is a very real possibility at this point – stay tuned for more from our research team.
Isn’t it time you learned how my research team and I can help you find and execute better trades? Do you want to learn how to profit from market moves? Our technical analysis tools have shown you what to expect months into the future, so sign up for my Active ETF Swing Trade Signals today to learn more! If you have a buy-and-hold account and are looking for long-term technical signals for when to buy and sell equities, bonds, precious metals, or cash then be sure to subscribe to my Passive Long-Term ETF Investing Signals.
Stay safe and healthy!
Chris Vermeulen
Chief Market Strategist
Founder of Technical Traders Ltd.
NOTICE: Our free research does not constitute a trade recommendation, investment or trading advice, or solicitation for our readers to take any action regarding this research. It is provided for educational purposes only. The Technical Traders research team produces these research articles to share information with you in an effort to try to keep you well informed. Visit our web site (www.thetechnicaltraders.com) to learn how to take advantage of our members-only research and trading signals.