With Three Trading Days Left Before The End Of Q2:2021 – Will The Markets Lead Us To Temptation Or Back To Work?
Headed into the July 4th holiday weekend, we have 3 more trading days in Q2:2021. We are starting to see a continual grinding higher in the US major indexes and various market sectors. The one thing my team and I believe is happening in the markets right now is “moderate complacency”.
After the FOMC statements just a few weeks ago and the continued support of the US Fed, the markets entered a period of moderate volatility. Currently, the markets appear to be settling in for moderately strong earnings expectations as Q2:2021 comes to a close. That means the markets will start to react to earnings and profit data as well as forward expectations presented by corporate statements along with the continued economic recovery attempt.
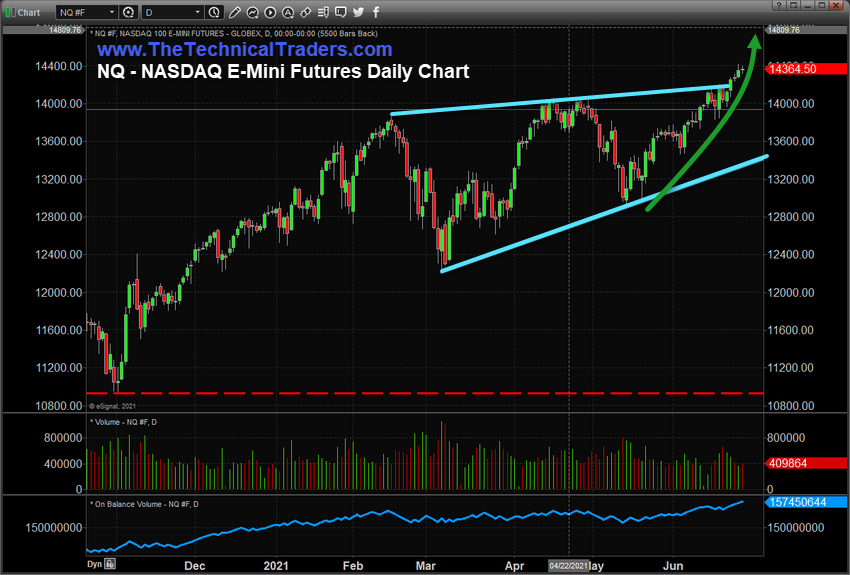
NASDAQ Grinds Higher – Breaks Upper Flag Channel Level
This NASDAQ Daily chart shows how the NQ has rallied above a Flag channel high and has begun to grind higher. Traders continue to expect upward price trending in expectation of stronger technology and other earnings data. This broad Flag pattern, shown on this chart by the CYAN lines, should highlight the level of volatility currently active in the NQ right now. The range between the upper and lower boundaries is more than 6%. Therefore, any surprise volatility may prompt a price rotation within this volatility range.
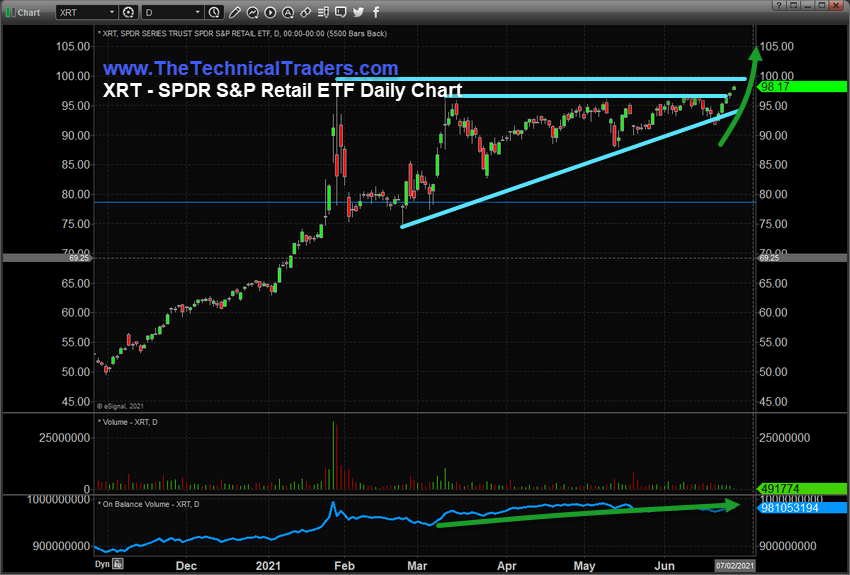
Retail Breaking Resistance And Attempting A Rally Above $100 – Get Ready
Retail will likely surge as earnings data is delivered showing a moderate increase in consumer spending. Additionally, as we are well into the start of Summer, there are likely a large number of consumers that are making big-ticket purchases (boats, cars, RVs/Trailers, toys) in support of Summer vacation plans. This surge of consumer spending after many months of lockdown and saving may prompt a wave of spending throughout the end of 2021 and into 2022. The stimulus checks also continue to help drive additional savings and spending.
Retail may surge to levels above $105 if profits and earnings data comes in strong over the next few weeks for Q2:2021.
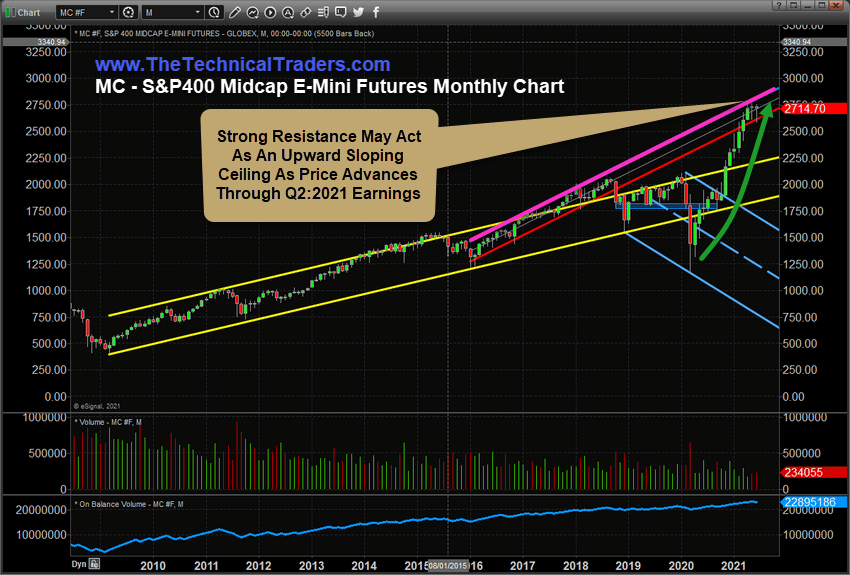
MIDCAPS Show Us Where Resistance Is Likely To Contain The Upward Grind
This Monthly chart of the SPDR S&P 400 Midcap Futures shows the resistance level that we believe will continue to act as a ceiling for the markets. The trends that started in 2016 and continued through early 2018 created a Standard Deviation channel range that trends almost perfectly to the current price highs. My researchers believe this upper Standard Deviation channel will continue to act as strong resistance as earnings data pushes the markets into a continued grind higher.
Sign up for my free trading newsletter so you don’t miss the next opportunity!
So, as we start to see the markets trend after the July 4th holiday weekend, stay keenly aware of where the current resistance/price ceiling is in the charts. It is likely that prices may attempt to reach above this level briefly, then stall sideways, or correct lower, as this upward trending channel represents extreme bullish trending.
The strongest market sectors are likely to continue to try to grind higher and attempt a 4% to 7% rally (or possibly more) as the markets prepare for Q2:2021 earnings and continued US economic recovery data. Traders are expecting solid earnings and further economic growth, and are thus putting their capital behind these expectations – grinding the markets higher right now. There is a very strong potential the strongest sectors will rally 5% to 8%, or more, over the next 25+ days. Are you ready?
Or, are you trying to make sense of where the opportunities are in these market trends? Are you still trapped in the thinking that guessing when and where to enter the markets will help you identify good trades?
Want to know how our BAN strategy is identifying and ranking various sectors and ETFs for the best possible opportunities for future profits? Please take a minute to learn about my BAN Trader Pro newsletter service and how it can help you identify and trade better sector setups. My team and I have built this strategy to help us identify the strongest and best trade setups in any market sector. Every day, we deliver these setups to our subscribers along with the BAN Trader Pro system trades. You owe it to yourself to see how simple it is to trade 30% to 40% of the time to generate incredible results.
From all my decades of experience, I can tell you that unless you have a solid foundation related to knowing when and where opportunities exist in market trends, you are likely churning your money in and out of failed trades. I will be presenting my two favorite strategies at the July Wealth365 Summit on July 13th at 4 pm and July 16th at 12 pm. The Summit is free to attend and offers unparalleled opportunities for learning…plus a potential prize or two!
Have a great day!
Chris Vermeulen
Chief Market Strategist
www.TheTechnicalTraders.com