Volatility Spike Shocks Markets – Resets Trend Systems
The recent volatility spike in the VIX prompted a very quick downturn in price levels across all US major Indexes over the past few trading days This sharp decline, although only lasting four trading days, prompted many systems to warn of a potentially much deeper price correction. As of the close of trading on Friday, January 29, 2021, it looked like a deep correction in price was setting up. Our proprietary BAN Trader Pro system also generated a “trend reset” trigger on Friday. This means our systems expected a change in trend, suggesting a bearish price trend was setting up, based on this spike in volatility and what appeared to be a moderately deep price trend.
VIX Hiccup Shocks Market Traders
The reality is that this downside trend move took place while a number of other factors were playing out. First, the Reddit group was targeting certain sectors/symbols in addition to the fact that the markets had already rallied a substantial amount since the November 2 election. This spike in the VIX index shocked a number of people and suggested a change in price trend.
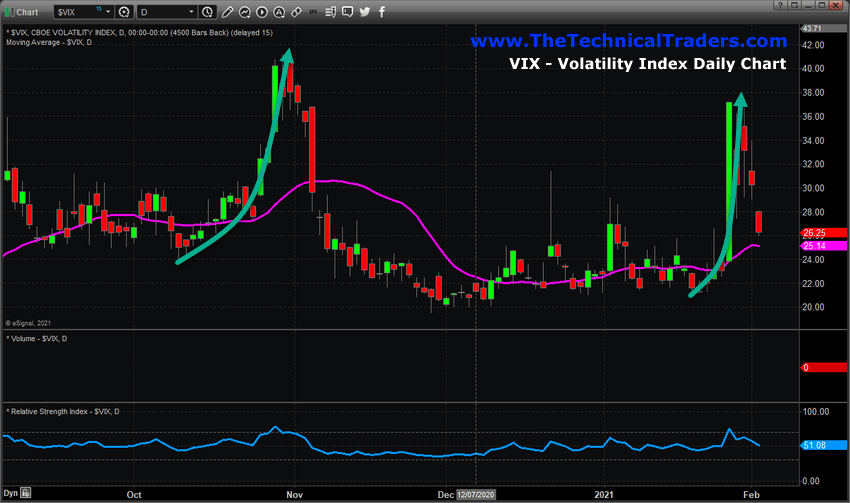
The VIX Daily chart below highlights the recent upward spike and how it compared to the last upward price spike leading up to the November 2 elections. I urge you to pay attention to how the two spikes are different. The October VIX spike took place over 14+ trading days and resulted in a peak level above 40. The current VIX spike took place over 5+ days and peaked near 38. Although the peak levels are similar, the breadth of this recent VIX spike was completely different – shorter and more immediate.

Historically, any VIX move above 35 is typically associated with a 6.5% to 11% downside price swing. Over the past 4+ years, any VIX move above 30 is typically associated with a more defined downside price rotation but not a deep price correction, rather a moderate downside price rotation at the very least. This time, the VIX spiked above 35 very quickly, over the course of 48 hours, then began to move substantially lower very early on Monday, February 1, 2021. This type of price rotation shocked the markets and many traders because we had not seen anything this volatile and short-lived in quite a while.
The reality of the situation is that the Reddit groups targeting sectors/symbols may have pushed a liquidity issue into the markets for the week ending January 29, 2021. Institutional traders and Hedge Funds were panicking over the short-squeeze and brokerage and clearing firms were also scampering around trying to secure additional capital to facilitate risks and trading volumes related to these retail trader events. This short-lived event may have prompted one of the strangest and shortest moderate price corrections in recent history.
-4.5% Price Decline Shocks The Markets Like A -15% Price Correction
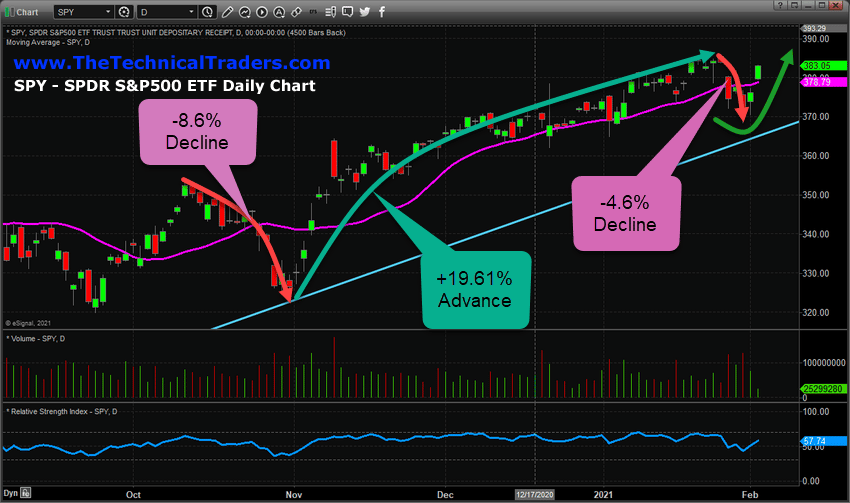
The following SPY Daily chart highlights the last price correction, in October 2020, where markets collapsed over 8.5% – prompting a VIX spike to levels near 40. After that rotation, the SPY rallied more than 19.5%. Recently, the downside price trend in the SPY of nearly -4.6% prompted a similar type of VIX spike – yet the actual downside price trend on the SPY chart was only about HALF of the previous decline in October 2020.
Be sure to sign up for our free market trend analysis and signals now so you don’t miss our next special report!
We believe the recent VIX spike was related to the disruption in the markets related to the Reddit targets and the fact that many symbols had already moved many standard deviations away from normal price levels. When something like this happens in the markets, it sends shock-waves to trading algos and system traders because the market price are acting in a very unusual way.

Most algos and computer trading systems are designed to watch for spikes in volatility or abnormal price activity. When this happens, many algos/systems are designed to pull risk away from the markets – leaving a liquidity trap. We believe this liquidity trap is what prompted the deep downside price trend on Friday, January 29, 2021, and the eventual resolution of that liquidity trap is what is prompting a sudden rally trend in early February 2021. In short, the Reddit group sent such a big price shock into the markets and brokerage/clearing firms last week, that a -4.5% price correction in the SPY prompted a massive VIX spike – almost as if a -9% to -11% price correction took place. The reason for this was likely because of a mild liquidity trap expectation where algos/systems/brokerages may have continued to come under increased pressure.
Volatility Spike Prompts Major Market Trend Reset
We are currently exiting this volatility event and things seem to be a bit more clear. The Dow Jones is rallying over +800 points so far this week. This entire volatility event may not be completely over yet, but it appears the markets are reacting as if the risks associated with the liquidity trap are behind us. What this means for many traders is that the market is setting up for a renewed upside price trend – likely attempting to rally 3~6% above recent highs before potentially stalling again.
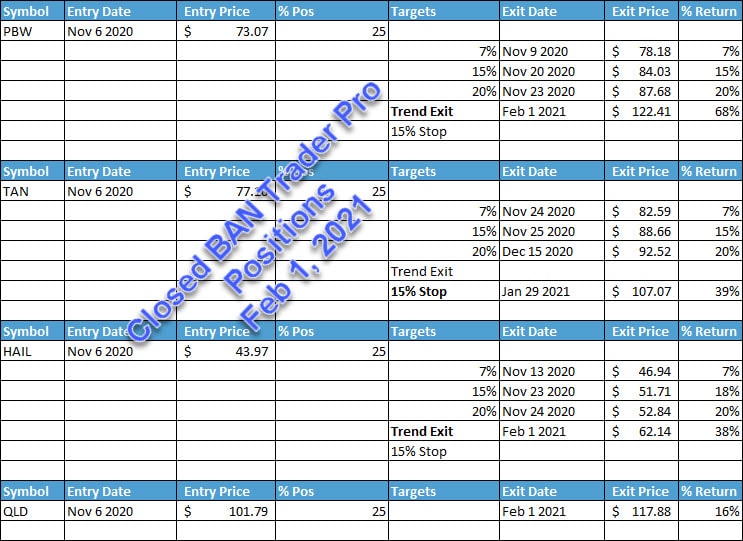
This trend reset prompted a profit-taking event by exiting positions on the trend change thereby locking in gains across a number of sectors . Our last set of trades taken using the BAN strategy (before it was launched to our subscribers on January 1) and Hotlist played out as follows below:

The recent upside price trend also prompted a new series of BAN trade alerts for my premium subscribers in the three hottest sectors and the leading Index. I am expecting the renewed upside price trend will initiate many new triggers on my BAN Hotlist that will create great trading opportunities for BAN Trader Pro subscribers. Traders who are looking for an edge with their options, stock, or ETF trading strategies can all enjoy the benefits of the BAN Hotlist rankings and indicators.
Don’t miss the opportunities in the broad market sectors over the next 6+ months, which will be an incredible year for traders of the BAN strategy. You can sign up now for my FREE webinar that teaches you how to find, enter, and profit from only those sectors that have the most strength and momentum. As some sectors fail, others will begin to trend higher. Learn how BAN Trader Pro can help you spot the best trade setups; staying ahead of sector trends is going to be key to success in these markets.
For those who believe in the power of trading on relative strength, market cycles, and momentum but don’t have the time to do the research every day then my BAN Trader Pro newsletter service does all the work for you. In addition to trade alerts that can be entered into at the end of the day or the following morning, subscribers also receive a 7-10 minute video every morning that walks you through the charts of all the major asset classes. For traders that want more trading than our 20-25 alerts per year, we provide our BAN Trader Pro subscribers with our BAN Hotlist of ETFs that is updated each day. We issued a new trade alert for our subscribers today and all four trades are well on their way to great returns!
Happy trading!
Chris Vermeulen
Chief Market Strategist
www.TheTechnicalTraders.com

