US Stock Market Sets Up Technical Patterns – Pay Attention
The recent “melt-up” in the US stock market after a moderate downside price move in early May 2020 has set up a number of technical patterns that traders need to pay attention to. This melt-up trend may continue for a bit longer, but price levels and actions are beginning to set up very clear patterns that warn of potential weakness in the future.
First, no matter how we attempt to spin the data, the US economy is very likely to fall into a moderate recession after the COVID-19 virus event has created a world-wide economic event and the recent riots and protests all across the US continue to disrupt and destroy property, businesses, and other assets.
It is almost like a one-two-three series of punches leading to a TKO. We have the virus event, the stay-at-home orders, and now the riots and protests. Recently, the National Guard has been called out to support local law enforcement and to protect people and properties. From our perspective, the situation is very far away from stable economic activity/growth supporting current stock price activity/levels.
We have been urging our friends and followers to be very cautious of long-side trades and to execute them with very narrow parameters, minor position sizes, and easy/tight targets and stops. The reason for this is because we are not confident that the underlying global economic fundamentals support the current price trends and activities. Yes, the US Fed is pouring trillions into the economy attempting to support the US and global markets, but the view from the ground level is very different from the Wall Street office on the 20th floor.
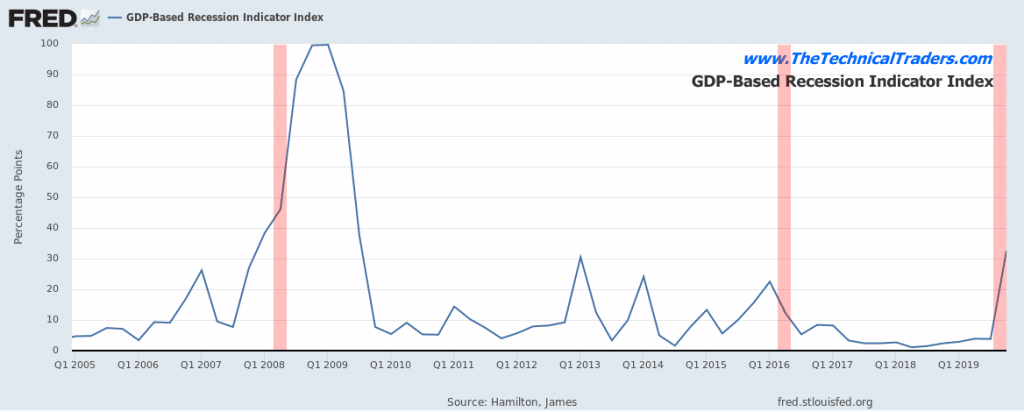
The GDP-Based Recession Indicator Index has risen to the highest levels since Q1:2008 as of April 2020 data. If it continues higher with the May 2020 data point, we’ll have more evidence that the US economy has entered the early stages of an economic recession. Remember, in early 2008, the US stock market had already begun to collapse more than 20% from recent highs. Currently, the SPY is trading only -9.63% below the all-time high levels. Our researchers continue to believe the US stock market is overvalued by at least 11% to 15% at current levels.
GDP-Based Recession Indicator Index
We continue to urge technical traders to be very cautious of the potential “washout-high” price pattern that is setting up and we continue to urge our followers to be very selective of active long trades. There is money to be made in this trend and certain sectors and symbols have rallied 10 to 15% over the past 4+ weeks – but technical traders need to be very aware of the active risks still playing out in the markets.
Before we continue, be sure to opt-in to our free market trend signals
before closing this page, so you don’t miss our next special report!
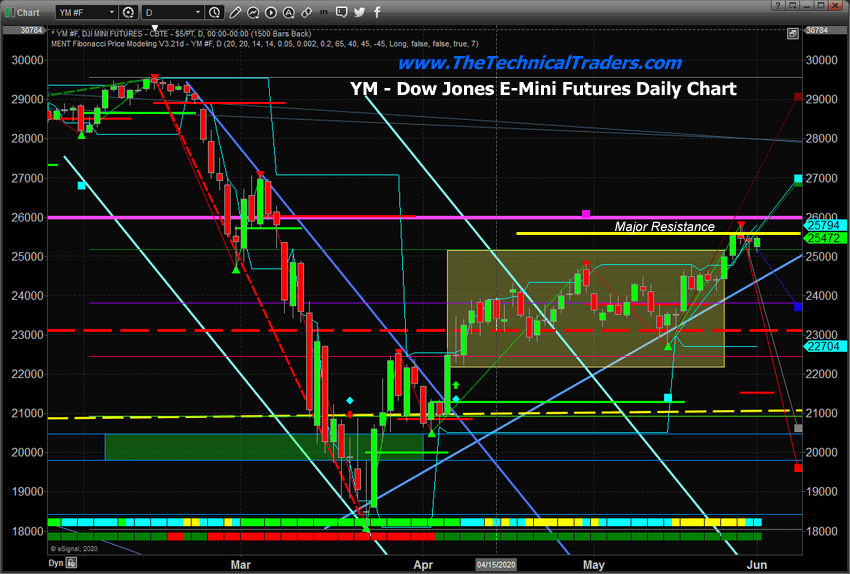
This Daily YM (Dow Jones E-Mini Futures Chart), highlights the major resistance levels near current price highs. The first, the MAGENTA line originates from our Adaptive Fibonacci Price Modeling system and is a key target/price level originating from the all-time price peak level. The reason this level is so important is that it continues to reflect the prominent downside price move/trend and this key Fibonacci level is still active until it is breached by price moving/closing above this level.
Second, the current Adaptive Fibonacci Price modeling system trigger level is highlighted in YELLOW. This level is going to act as a “trigger point” in price. If price rallies above this level and closes above this level, then we may see more upward price activity over the next few days/weeks. If price fails to close above this level and stays below this level, then we interpret this as a failure to achieve the trigger level and it would suggest that price may begin to move downward – away from this critical price trigger level.
Watch for the YM to move to levels near or above 25,600 and watch how it reacts to this key resistance level. If it rallies above this level then fails and begins to move dramatically lower – this level is being rejected and a new bearish trend may setup. If it moves above this level and closes above this level, then we have confirmation of a potential upside price trend and bullish trending may continue for a bit longer.
DOW JONES E-MINI FUTURES DAILY CHART
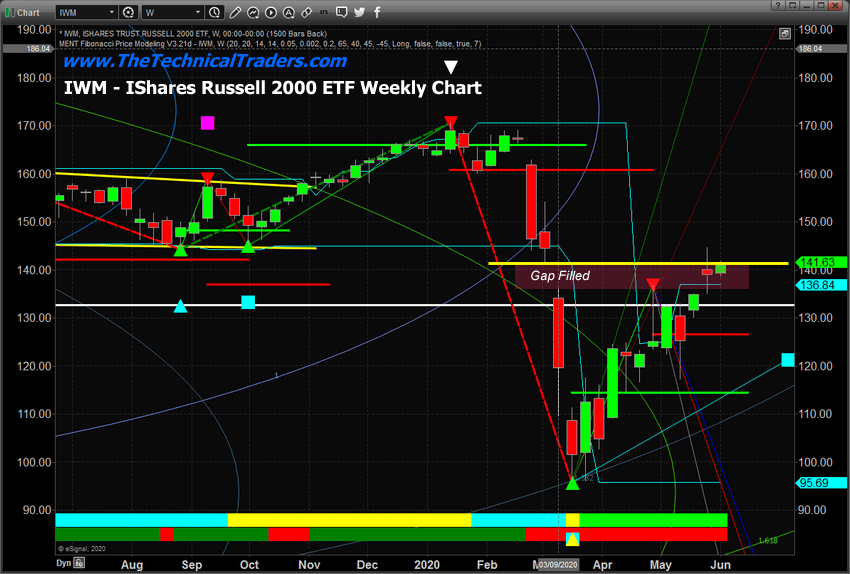
This next Weekly chart, the IWM (Ishares Russell 2000 ETF), highlights another key technical pattern – a Gap Fill. We’ve been watching how capital has transitioned from the NASDAQ and S&P500 and into the Mid-Caps and other sectors over the past 4+ weeks. Once the major indexes began to reach levels near the past all-time highs, capital began seeking out undervalued sectors and technical traders began rotating into these sectors expecting a moderate price rally to occur.
Not that the Russell 2000 has rallied up to fill this gap, it is very likely that some level of moderate price weakness will setup – possibly pushing price levels lower. A Gap Fill is a technical pattern that suggests any Gap in price will eventually get filled by future price activity. Once this Gap is Filled, the price has completed a technical pattern to “fill the void”. After the Gap is filled, price usually stalls and moves in the opposite direction for a period of time – establishing a new base for a new momentum move.
We believe the filling of the GAP on this IWM chart suggests the Mid-Caps may have reached a key resistance level and may begin to move downward in the near future – likely attempting to establish a new momentum base near the $122 level.
IWM – ISHARES RUSSELL 2000 ETF WEEKLY CHART
We love this market volatility and how various sectors are rotating right now. It presents incredible opportunities to be able to select new trades. We are still being very cautious overall with our portfolio. We’ve been able to achieve new highs in our accounts by selectively trading various symbols and targeting exit points using our proprietary trading technology. Right now, we have two active trades that continue to generate solid profits. No reason to go crazy trying to pick dozens of trades with our “Best Asset Now” modeling system. It allows us to attempt to stay active while trading the best asset class in the markets.
Watch how the markets react this week and early next week. We recently posted a research article about the US Presidential cycle and how June/July is often very difficult months in an election year. You may find this research article very informative as we push forward into the Summer months of this 2020 election hear
Election Year Cycles – What To Expect?: https://thetechnicaltraders.com/election-year-cycles-what-to-expect/
I hope you found this informative, and if you would like to get a pre-market video every day before the opening bell, along with my trade alerts. These simple to follow ETF swing trades have our trading accounts sitting at new high water marks yet again this week, not many traders can say that this year. Visit my Active ETF Trading Newsletter.
If you have any type of retirement account and are looking for signals when to own equities, bonds, or cash, be sure to become a member of my Long-Term Investing Signals which we issued a new signal for subscribers.
Ride my coattails as I navigate these financial markets and build wealth while others lose nearly everything they own during the next financial crisis.
Chris Vermeulen
Chief Market Strategies
Founder of Technical Traders Ltd.