Natural Gas Sets Up Bottom Pattern
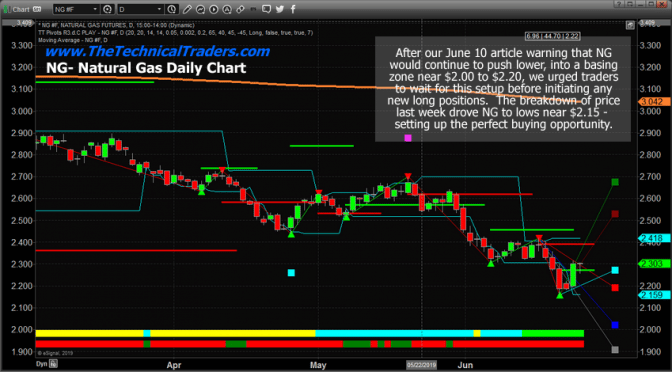
In less than two weeks, our prediction that Natural Gas would move lower into our “basing zone”, between $2.00 and $2.20, has come true. Natural Gas has fallen into our expected basing/bottoming zone and traders should be looking to target low price entries as the extended setup of this base takes place.
You can read our original research post regarding our Natural Gas analysis from June 10, 2019: NATURAL GAS MOVES INTO BASING ZONE
It is our belief that anytime Natural Gas falls below $2.20, or lower, traders should consider jumping into NG related ETFs or NG future as this bottoming zone will likely push NG back above $2.35~$2.40 fairly quickly. Historically, any price move to levels closer to $2.00 have been very strong support for Natural Gas and this early basing pattern is setting up for an incredible opportunity for traders.
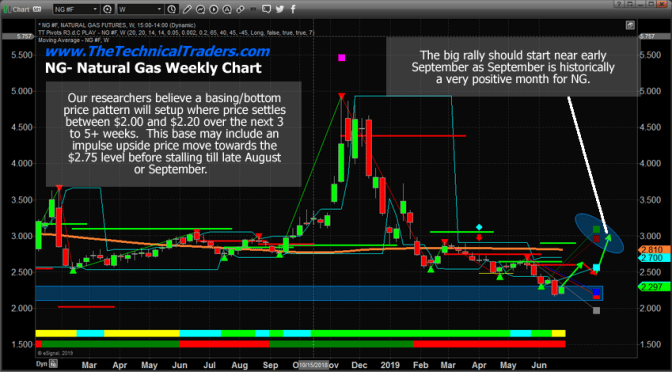
Ideally, we are expecting an upside the month of July to represent continue basing/bottoming in NG where we expect NG prices to rotate between $2.00 and $2.75. There is a moderate change that NG prices may attempt a move above $2.75 after July 20.
We believe August will result in a sideways downward sloping price pattern that may last only through the first 10 to 15+ days of August. The month of August is typically relatively muted in terms of price trend but includes greater price volatility – bigger price bar ranges.
The big breakout move will likely begin to happen in late August or early September. September, October, and November are all historically strong months for NG. September is the strongest month historically, October represents about half the upside strength of September and November represents, again, about half the upside strength of October.
Overall, this basing/bottoming pattern in NG is something skilled traders do not want to lose focus of. The opportunity at these sub $2.25 levels is incredible if traders are able to time their entries and plan for the August/September upside price launch. Looking back at historical price patterns, we could begin an upside price bias (a slower moving upside price trend) in early July. After NG hammers our a bottom near this $2.00 level and settles near support, the new trend should become evident as an upside price bias before the August/September liftoff.
This Daily NG chart shows the RED and CYAN Fibonacci projection levels (near $2.18 and $2.28). These levels will act as both a floor and ceiling for the future price as the basing pattern continues. Any breakdown in price below $2.18 would be a great entry level for skilled traders. There is a potential that price could drift a bit lower, possibly down to near $2.00 over the next few weeks, but we believe the basing/bottoming setup is beginning and support will be found above $2.00.
This Weekly NG chart shows a BLUE rectangle that highlights the support level identified by our proprietary Fibonacci price modeling system. Right now, this support level is between $2.10 and $2.30. These Fibonacci downward price projection points on the Weekly chart represent expected levels/targets for downward price SUPPORT to form. In other words, from the last price peak, price should move lower and target these Fibonacci projected targets where they will likely stall, bottom or attempt to find support – potentially setting up a new price “trough”.
We believe the next upside price move will happen between now and July 25th where NG will move from the $2.15 level to somewhere near $2.55 to $2.65. After that move, we expect the price of NG to stall briefly before beginning another leg higher towards $3.00 or higher. Our expectations of that last leg are that it may begin near mid-August and really begin to accelerate as we get closer/into September.
Remember, this is a very early set up – we still have 40+ days of expected basing/bottoming before any real upside potential is likely. Now is the time to trade this as short term 4~8% price objectives taking very skilled trades near the low price levels and targeting quick profits. As we enter July and move into August, we suggest traders switch from the short-term scalping mode and begin to consider the September, October & November historical price patterns to truly understand the upside potential.
Take a look at that huge move in 2018 over those same three months (September, October, November) in the chart above. That move started from the $2.65 level and ran all the way up to near $5.00. The same thing could happen again this year with price originating from a $2.00 basing level.
I can tell you that huge moves are about to start unfolding not only in the energy sector but in metals, and stock indexes and some of these super cycles are going to last years. A gentleman by the name of Brad Matheny goes into great detail with his simple to understand guide and charts. His financial market research is one of a kind and a real eye-opener. PDF guide: 2020 Cycles – The Greatest Opportunity Of Your Lifetime
CONCLUDING THOUGHTS:
In short, Nat Gas is oversold and showing signs of a bounce.
As a technical analysis and trader since 1997 I have been through a few bull/bear market cycles, I have a good pulse on the market and timing key turning points for both short-term swing trading and long-term investment capital. The opportunities are massive/life-changing if handled properly.
Take a look at my Wealth Building Newsletter and if you like what I offer, join me with the 1 or 2-year subscription to lock in the lowest rate possible and ride my coattails as I navigate these financial market and build wealth while others lose nearly everything they own.
Chris Vermeulen
www.TheTechnicalTraders.com