Natural Gas Moves Into Basing Zone
After an incredible rally in Natural Gas that our researchers called perfectly in November 2018, another opportunity for an upside price move appears to be setting up for later this year. We believe the current price lows, near $2.30, are setting up for a bounce and then will drop and form a basing pattern near $2.00 before rocketing higher. It is this last move to the downside which will set up the incredibly deep price base and oversold conditions for the upside price move in late August/September 2019.
We’re issuing this research post to alert all of our followers to our research and to allow for proper price rotation for this base to set up and conclude before jumping into any false triggers that may occur on the Daily or Weekly charts.
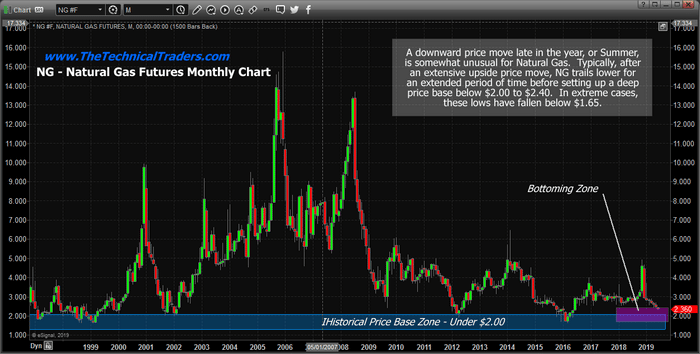
Start by taking a look at this Monthly NG chart showing how extended high price peaks are usually followed by extended price declines. It is very unlikely that any upside price move will begin before late August or early September 2019.
In fact, our data mining utilities confirm this by suggesting that June, July, and August are all typically lower price months by a factor of 1.5:1 and 2:1 mostly over the past 24 years. September is the first monthly data point to break this cycle with a positive historical price bias of nearly 9:1.
Therefore, the closer we get to September 2019, the more likely we are going to see a basing in price near $2.00 (or below) and traders would be wise to prepare for this move before it happens.
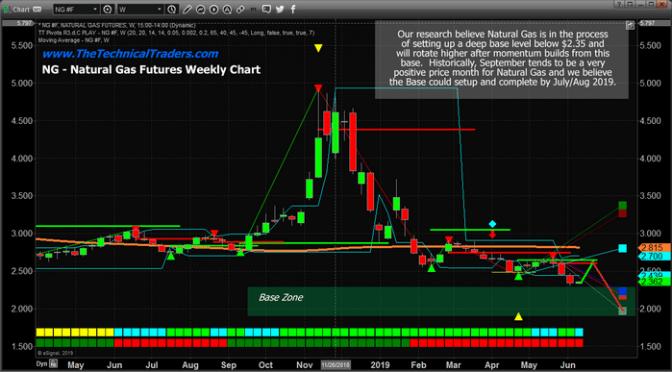
Our Weekly Fibonacci price modeling system is suggesting a moderate move upward of about $0.25 is likely over the next few weeks before price may rotate lower, again, and attempt to fall below the $2.25 level as it continues to rotate towards the ultimate base.
Our researchers believe the ultimate price base will be near $2.00 (roughly between $1.85 and $2.15) as our Weekly Fibonacci modeling tool is suggesting. After price establishes the new price peak in late June, we’ll have more data to compare for the proper location of the ultimate price base.
In fact, there are several super cycles starting to take place and we head into 2020 and beyond which Brad Matheny and layout in our new book: 2020 Cycles – The Greatest Opportunity Of Your Lifetime
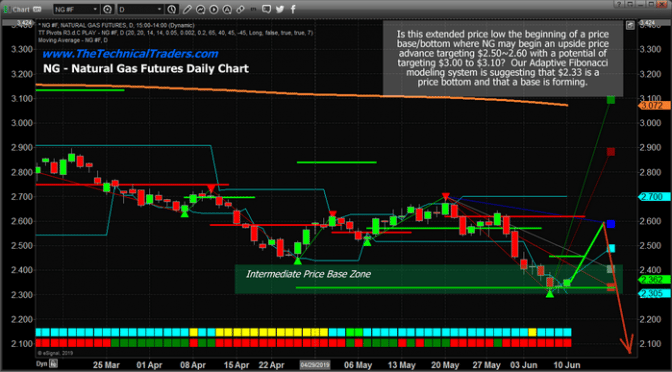
This Daily chart highlights our expectations for NG over the next few weeks – fairly strong potential for a move higher, above $2.50, where the price will stall and reverse back to the downside. Ultimately, this peak will turn out to be nothing more than required price rotation to support the ultimate base pattern setup later in August or September 2019.
Don’t get too excited about Natural Gas just yet. The setup and future trade are in the process of creating a deep price base that will likely end near late August or early September 2019. We believe September 2019 will be the breakout month for NG as a price advance really takes hold. If historical data is any guide, the 9:1 upside bias of September following the 1.4:1 downside bias of August suggests that the September upside price move could push NG prices well above $3.50 or $4.00 very quickly.
If you wanna become a technical trader with use and trade ETFs then be sure to join our Wealth Building Newsletter today and get our daily video analysis and swing trade alerts. In the past 17 months, our newsletter trade signals have generated 91% ROI for its subscribers, be sure to join before the markets start making new big moves and profit with us!
Chris Vermeulen
www.TheTechnicalTraders.com