NATURAL GAS BEGINS UPSIDE BREAKOUT MOVE
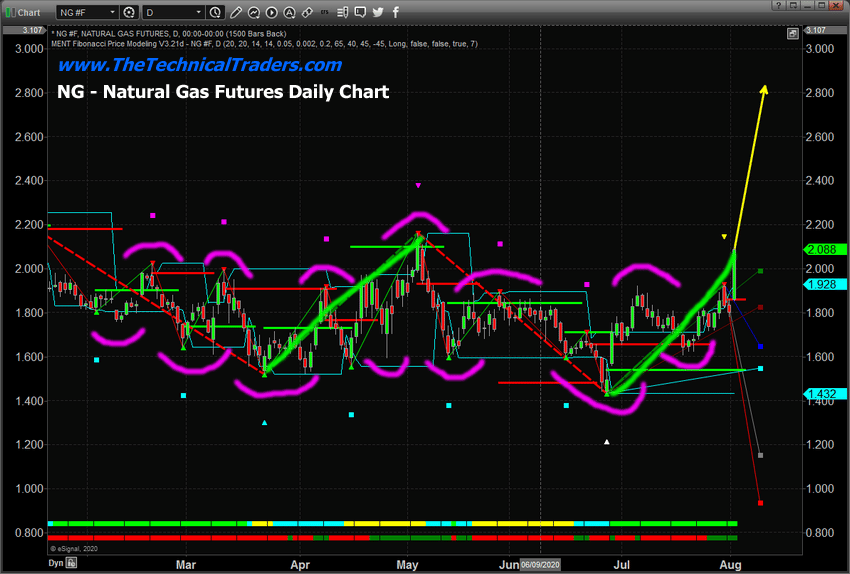
First, we want to say “It took long enough!” and we’re happy to see this upside move in Natural Gas. We had been calling this move for many months. Our predictive modeling systems and cycle systems suggested the extended bottoming formation in Natural Gas was an excellent opportunity for skilled technical traders. Today’s big move suggests the downside price pressure is dissipating and a new bullish price trend may push Natural Gas prices above $2.85 quickly.
Our research team spotted this potential setup in April and May articles where we correctly predicted an NG rally in April (it did!) and new upside targets for NG in May. We have been keeping our subscribers up-to-date with UNG as this bottom has played out.
The upside move in late April 2020 was a cycle move that we expected to continue a bit higher. It still presented a very nice opportunity for skilled traders to capture a 35% upside price swing. The current, deeper, price bottom near $1.43, represents a very deep rotational bottom in Natural Gas and the current upside price move may be just starting. Our researchers believe the initial target for this move is $2.85. After that level is reached, if the trend continues, a higher target near $3.65 could become a very real price target.
Be sure to opt-in to our free market trend analysis and signals now so you don’t miss our next special report!
NATURAL GAS RISE IS STARTING EARLY
Historically, August has not been an impressive month for Natural Gas. Over the past 24~25 years, August represents a muted average upside range of $0.52 and an average downside range of -$0.73. These monthly historical cycles suggest an almost even split with 12 months moving higher and 13 months moving lower. Yet, when we move to September, things change.
September on the other hand has historically presented a very strong upside potential in Natural Gas with an average upside range of $0.69 and an average downside range of -$0.22. This suggests the upside potential in September is nearly 300% larger than the downside potential. Additionally, over the past 24 years, Natural Gas has moved higher 16 months and lower only 8 months. This suggests the upside price rally in September is nearly a 2:1 certainty.
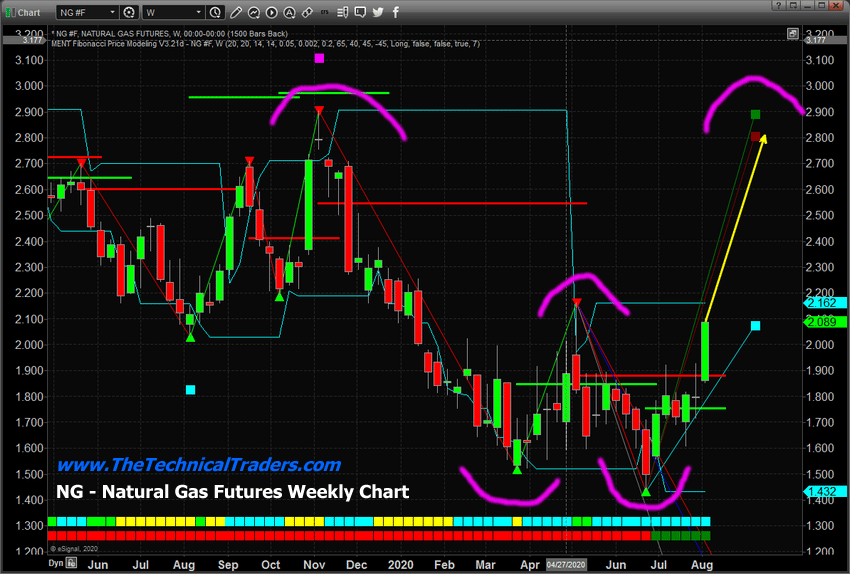
Quite possibly, the extended bottoming formation in Natural Gas over the past 3+ months is setting up an early rally mode where price levels may move towards our $2.85 price target, then stall headed into September. Once September arrives, Natural Gas prices may begin another upside move pushing well above the $3.50 level.
The $2.16 level represents critical resistance right now. It is very likely that prices will stall near this level before attempting a bigger move higher. Supply issues may present a situation where prices breach this level quickly though. Once the buying rally sets in, Natural Gas can move very quickly, over a few weeks, to incredible peak levels.
Skilled traders who were able to navigate this bottom and get into positions in UNG or futures will likely be very pleased with what we believe will be a moderately easy 40% upside move. The UNG trade will begin to accelerate higher as Natural Gas clears the $2.85 price level.
Play this trade cautiously as it progresses – pulling 30% to 60% of profits moderately early to protect against the eventual “peak and sell-off”. If you know anything about Natural Gas in a rally mode, it should be that the peaks can be incredible, but the eventual sell-off can be very quick and dangerous. Take your profits and be happy you caught a good trade.
September may be a big surprise for NG traders with a really nice upside price move that no one expects right now if our research is correct.
Get our Active ETF Swing Trade Signals or if you have any type of retirement account and are looking for signals when to own equities, bonds, or cash, be sure to become a member of my Passive Long-Term ETF Investing Signals which we are about to issue a new signal for subscribers.
Chris Vermeulen
Chief Market Strategist
Founder of Technical Traders Ltd.
NOTICE: Our free research does not constitute a trade recommendation or solicitation for our readers to take any action regarding this research. It is provided for informational and educational purposes only. Visit our web site (www.thetechnicaltraders.com) to learn how to take advantage of our members-only research and trading signals.