Metals/Miners Shifting Gears – Are You Ready For What’s Next? – Part I
The recent bottom in Metals/Miners has everyone excited to see what this next upside price leg is capable of achieving. The extended Pennant/Flag formation that setup a peak in August 2020 has nearly reached the Apex. The upside move in Gold and Silver, as well as Junior Miner ETFs, over the past few weeks suggests a new upside price trend is setting up. The concept that commodities and metals are very new to historically low price levels sets up expectations that a longer-term price advance could send Gold above $3750 and send Silver above $50 as expectations adjust to the new price cycles.
WHERE ARE WE IN THE COMMODITY/METALS CYCLE?
Some of my team’s recent research has highlighted our belief that we are just starting a Depreciation cycle for the US/Global stock market which aligns with the historic lows for Commodities/Metals. Take a look at our analysis of the Gold and the US$ cycle, Gold and the SPY and QQQ, and our price targets for Gold using our proprietary ADL tool for some additional background.
Using our proprietary price modeling and Adaptive Learning technology, we’ve identified a broad market cycle that lasts between 9 to 9.5 years (on average) and we believe a US stock market appreciation phase ended in 2018~2019. We feel the current rally in the US stock market is an “excess phase” (blow off top) rally that may extend well into early 2021 before suddenly shaking out the hype. This same type of enthusiasm is taking place across the globe and in various classes of assets (Cryptos, various market sectors, Metals and Essential Minerals, and others). The US Fed, and global central banks, are fueling the rally with easy monetary policies – attempting to keep the party going.
Be sure to sign up for our free market trend analysis and signals now so you don’t miss our next research report!
We suggest traders watch how hedging instruments react to this excess phase over the next 12 to 24 months. When precious metals, miners and Cryptos (which have now become a new hedging instrument) begin to rally when the US stock market is flat or devaluing – then we may be very close to the end of the excess phase.
Bloomberg Commodities Index Bottom
These long-term Bloomberg Commodities Index and Silver to M2Money Supply charts highlight the extended downtrend in commodities over the past 12 years. Interestingly, this decline in the Commodities Index,hart below, aligns with our longer term Appreciation phase in the US stock market from 2009 to 2018~19.
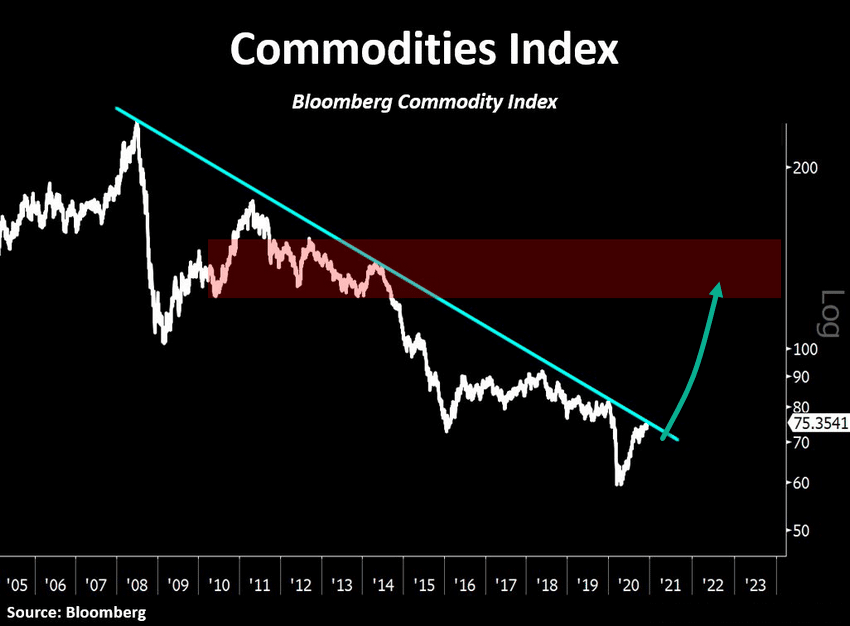
The deep lows of the COVID-19 market collapse may have setup a major bottom in the Commodities Index going forward. If our research is correct, commodities should start a major upward price trend which lasts for 5 to 7 more years. We have highlighted a mean price range (in RED) from the 2009 to 2013 area suggesting commodity prices could recover to this level fairly quickly in a new Appreciation phase.
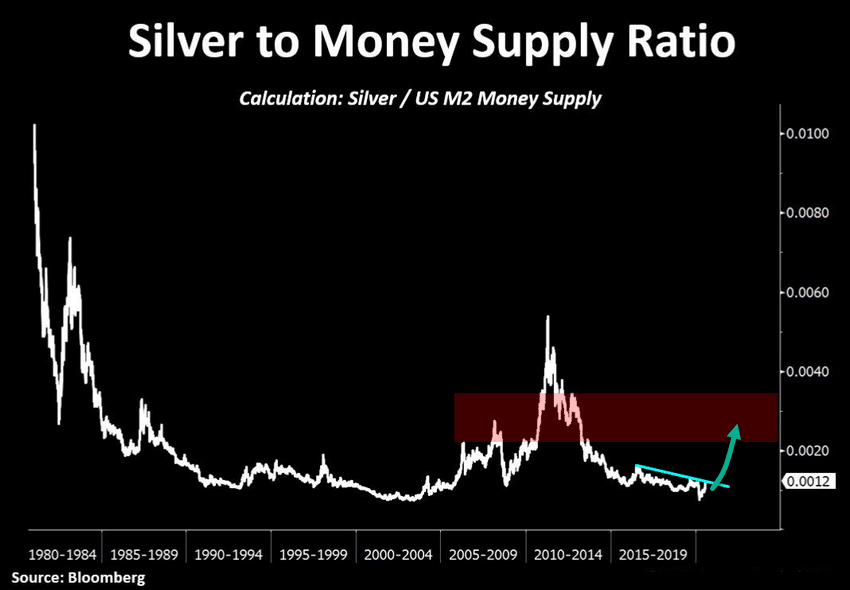
Bloomberg Silver to Money Supply Ratio
The following Silver to Money Supply Ratio chart highlights how inexpensive Silver is in comparison to historical values. Even though Silver is trading near $26 per ounce right now, historical mean levels in Appreciation phases suggest Silver could rally 200% to 300% (or more) from these lows. We’ve highlighted an area in RED on this chart showing a moderate mean average of the last Appreciation phase (2004 through 2011).
In the second part of this research article, we’ll go over the setups in various Gold and Silver miner charts that may represent an incredible opportunity for traders. If you understand the scope and consequences of these broad market cycles, the Appreciation/Deprecation cycles, and what this means for commodities, metals, miners and other assets, then you will quickly understand we are in the midst of a shift in these cycles. We must prepare for what is next so we can adapt our trading style to profit from these new big trends.
Take a minute or two to read the other research articles I’ve linked to at the start of this article. It is important that you understand the longer-term cycles that are unfolding and how these cycles present very real opportunities for traders. Then visit www.TheTechnicalTraders.com to learn about our Best Asset Now (BAN) strategy where we identify the best ETFs and other assets in any market trend. BAN allows us to quickly identify when and how to invest our capital in top performing asset classes. Trading the hottest sectoral ETFs helps us beat market returns without having to scan and pick from thousands of stocks.
Happy Trading!
Chris Vermeulen
Chief Market Strategist
www.TheTechnicalTraders.com