Adapting Dynamic Learning Shows Possible Upside Price Rally In Gold & Silver
Our advanced Adaptive Dynamic Learning (ADL) modeling system is showing some interesting future trends for both Gold and Silver. The rally in precious metals has really just started if our ADL system is accurately predicting future price trends.
Over the past two years, we’ve highlighted a number of ADL research posts that have proven to be incredibly insightful regarding future market price trends. The ADL predictive modeling system is unique in that it maps out price and technical indicator DNA markers and attempts to correlate future price characteristics into highly probable outcomes. The result is a clear picture of what the ADL system believes is the most likely outcome based on the selected price bar.
We attempt to use the ADL system to identify highly populated ADL DNA price bar markers and very infrequently populated ADL DNA price bar markers. We believe the highly populated ADL entries are ones that happen with some degree of regularity and are likely to prompt similar future price outcomes. We believe the infrequently populated ADL DNA entries are anomalies in price that may present unusually accurate price bar outcomes. Therefore, when an ADL entry shows seven (7) or more correlative matches, we consider that moderately highly populated. When an ADL entry shows less than three (3) correlative matches, we consider that infrequently populated.
GOLD ADL MONTHLY CHART SUGGESTS $2250 TO $2350
Let’s start out with a Gold Monthly ADL chart below. It is showing a broad upside price trend initiating in late 2020 or early 2021. It is very likely that Gold will attempt to reach $2250 or higher by April or May 2021 (possibly sooner)after a flat December. It appears the real bullish trend starts to take place in early 2021 and continues into July 2021.
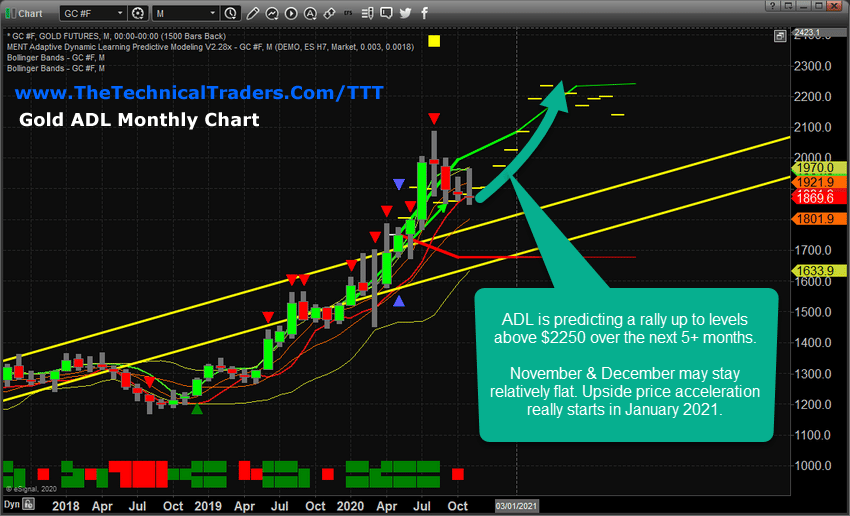
Notice how the ADL predictive price levels after July 2021 suggest Gold will stall near or above $2100. It is very likely this range of time represents some level of economic growth taking focus away from metals temporarily. The ADL DNA marker for this future price prediction consisted of 17 unique instances of this DNA marker – resulting in a range of probable outcomes between 92% and 99% likely success. With these high probability outcomes across 17 unique instances of ADL DNA mapping, we are fairly confident that Gold will follow along this projected price path over the next 12+ months.
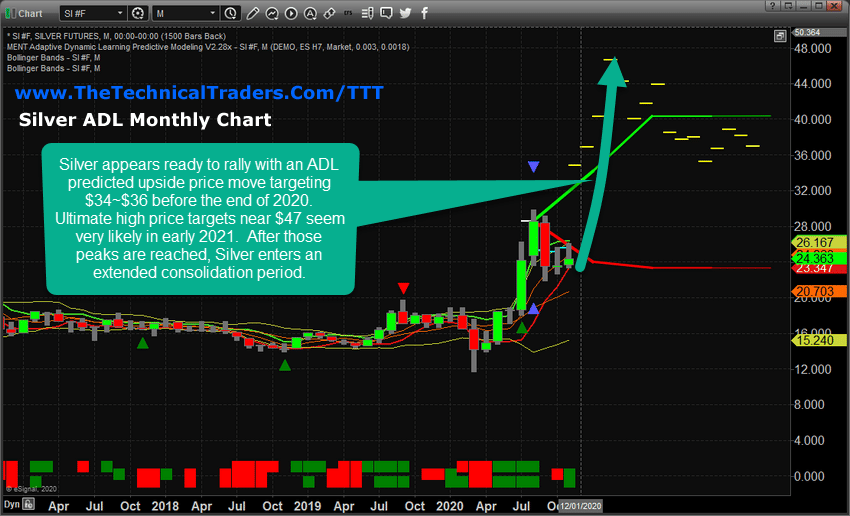
SILVER’S EXPLOSIVE ADL MONTHLY CHART
This next Monthly ADL Silver chart shows an incredible upside price explosion that is just 30 to 90 days away from blowing the doors off. This ADL price prediction mapped out at 20 unique instances with a probability range of 56% to 76% for the first 4 bars of this pattern (August 2020 through November 2020), then followed by 81% to 86% probable outcomes for the rest of the ADL predicted outcomes.
This chart is really exciting because it suggests Silver is about to explode up to $44 or higher while Gold begins to move higher in January/February 2021. This suggests that Silver, which is currently undervalued to gold by historical ratio levels, should begin to really rally much higher – starting to close the ratio levels towards more normal levels.
The Gold to Silver ratio level is currently near 0.84. Historically, anything above 0.80 has represented a peak in Gold to Silver price ratios – which initiated a stronger upside price move in Silver to close the ratio gap. The recent peak in the Gold to Silver ratio level reached levels near 1.20 in April 2020. This is a very big ratio disparity between gold price levels and Silver price level. If Silver rallies to levels above $40 soon, the Gold to Silver ratio will likely fall to levels near 0.62~0.65. These levels represent historical normal ratio levels for metals.
Be sure to sign up for our free market trend analysis and signals now so you don’t miss our next special report!
Notice on this Monthly ADL Silver chart that Silver begins to trail lower after July 2021 – very similar to the Gold ADL chart. This suggests some economic functions will detract from metals and shift the focus away from Gold and Silver (possibly briefly). Any way you look at these ADL predictions, Gold and Silver are likely to start a big upside price move with the next 60+ days. The probability that Platinum and Palladium will follow Gold and Silver is quite high. In fact, Platinum has already started a broad upside price trend which may be an early indication that Silver and Gold are poised for a breakout move.
Remember, the ADL predictive modeling system is attempting to show us what it believes are the highest probability outcomes based on a single ADL DNA price marker. In the past, the triggers from our ADL predictive modeling system have been highly accurate in the past – calling the 2018~2019 move in Gold and calling the 2019 collapse in Crude Oil. We caveat that there are instances where outside economic or global event disrupts price activity. Clearly, additional outside events could result in different price activity than our ADL predictive modeling outcomes.
Do you want to learn more about what we do and the incredible proprietary technology we use to help our members and to identify trade setups? We can help you find and identify great trading opportunities so visit www.TheTechnicalTraders.com to learn about my exciting ”Best Asset Now” strategy and indicators. You can also sign up for my daily pre-market video reports that walks you through the charts of all the major asset classes every morning.
Enjoy the rest of your Sunday!
Chris Vermeulen
Chief Market Strategist
www.TheTechnicalTraders.com