Many Sectors Are Primed For Another Breakout Rally – Are You?
As we start moving into the Q1:2021 earnings season, we need to be aware of the risks associated with the volatility often associated with earnings data and unknowns. Nonetheless, there are other factors that appear to be present in current trends which suggest earnings may prompt a moderately strong upside breakout rally – again.
One key factor is that the US markets are already starting to price in forwarding expectations related to a reflation economy – a post-COVID acceleration in activity, consumer participation, and manufacturing. Secondarily, we must also consider the continued stimulus efforts, easy monetary policy from the US Fed, and the continued trending related to the 12+ month long COVID-19 recovery rally.
In some ways, any damage to the economy related to COVID-19 may have already happened well over 6+ months ago. Certainly, there are other issues we are still dealing with and recovering from, but the strength of the US economy since May/June of 2020 has been incredible. When we combine the strength of the economic recovery with the extended support provided by the US Fed and US government stimulus/policy efforts, we are left with only one conclusion: the markets will likely continue to rally until something stops this trend.
Just this week, after stronger inflation data posted last week, and as earnings data starts to hit the wires, we are seeing some early signs that the US major indexes are likely to continue to trend higher – even while faced with odd earnings data. If this continues, we may see the US major indexes, and various ETF sectors, continue to rally throughout most of April – if not longer.
Come watch over 60 investment and trading LEGENDS share their secrets with you for free – click here for your FREE REGISTRATION!
Today, Aphria (APHA), announced a third-quarter “miss” on sales, and net operating loss fell more than 14%. This tugged many Cannabis-related stocks lower and pulled the Alternative Harvest ETF (MJ) lower by over 4%. Still, the Transportation Index, Financial sector ETF (XLF), and S&P500 SPDR ETF (SPY) rallied to new all-time highs.
This suggests the market is discounting certain sector components as “struggling” within a broadly appreciating market trend. In this environment, even those symbols which perform poorly won’t disrupt the Bullish strength of the general markets. Because of this, we believe the overall trend bias, which is Bullish, will continue to push most of the market higher over the next few days/weeks… at least until something happens to break this trend or when investors suddenly shift away from this trend.
SPY Rally May Be Far From Over At This Stage
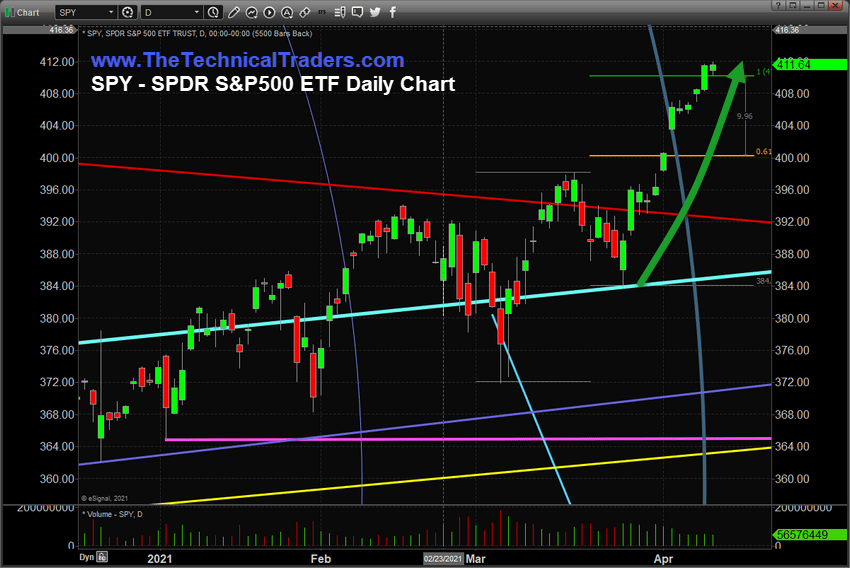
Let’s start by reviewing this SPY Daily chart below (S&P500 SPDR ETF). As you can see, the recent rally has already moved above the GREEN 100% Fibonacci Measured Move target level near $410. Any continued rally from this level would suggest an upside price extension beyond the 100% Fibonacci Measured Move level is initiating. This type of trending does happen and can often prompt a higher target level (possibly 200% or higher) above our initial targets.
What is interesting in our review of these charts is the SPY may be rallying above recent price range targets, using the Fibonacci Measured Move technique, but other sectors appear to really have quite a bit of room to run.

Transportation Index Continues To Suggest Stronger US Recovery
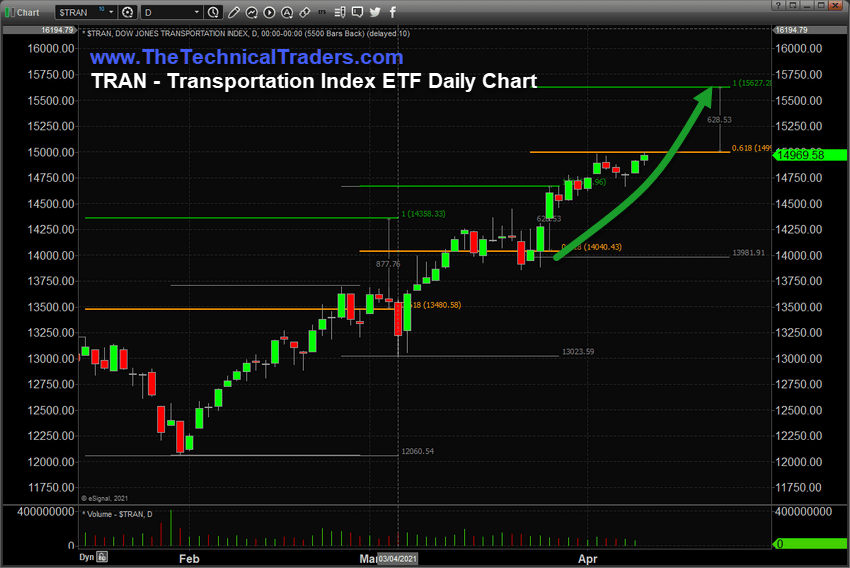
This Transportation Index Daily Chart, TRAN, suggests a target level near $15,627 so it is reasonable to assume the Transportation Index may continue to rally more than 4% higher from current levels. Ideally, if this were to happen, it would suggest the broader economic recovery is strengthening and we may expect to see the US major indexes continue to rally higher as well.

At this time, when economic data and Q1:2021 earnings are streaming into the news wires, we usually expect some extended volatility in the markets. The VIX may rally back above 19 to 24 over time if the markets reflect the varied earnings outcomes we expect. Yet, we believe the overall bias of the markets at this stage of the trend is solidly Bullish.
Financial Sector ETF Ready To Rally Above $37
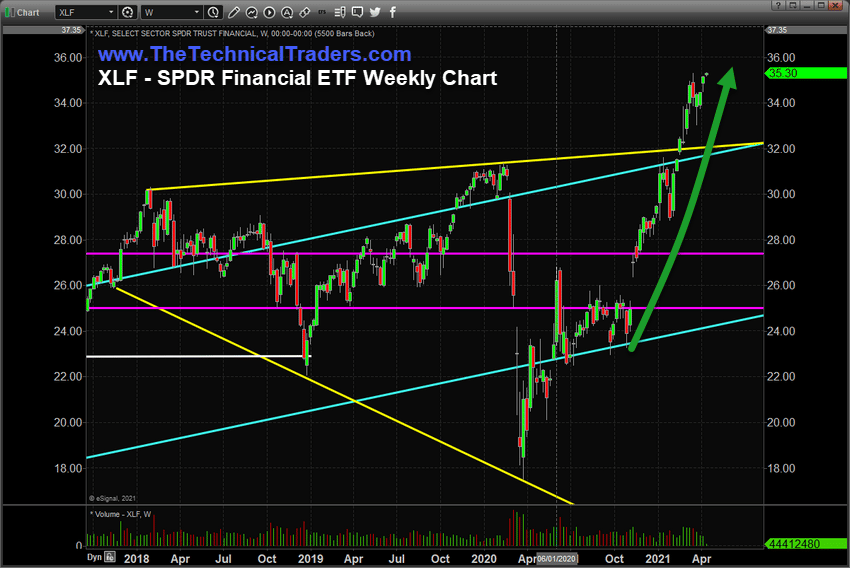
The Financial sector ETF (XLF), as seen in the following chart, is poised to break higher after a dramatic recovery in price after December 2020. The rally from $29 to over $35 represents a solid +20% advance and the recent resistance level, near $35.30, is a key level to watch as this sector continues to trend. Once that resistance level is breached, we believe a continued rally attempt will target $37, then $39.40.
The expected recovery in the US economy will prompt more consumer spending and the use of credit. Over the past 8+ months, US consumers have worked to bring down their credit levels and saved more money because of the change in how we addressed COVID work-styles and lack of travel (and extra money from the Stimulus payments). That may not change right away, but eventually, consumers will start to engage in the economy as travel starts to recover and summer activities start to take place. This suggests spending, travel, vacationing, eating out and other activities will prompt a new wave of economic activity within the Financial Sector.

The US markets are uniquely poised to further upside price gains because the US has such a dynamic core economy. Our base of consumers is, generally, working in jobs, saving more, and more capable of traveling within the US to engage in summer activities. Because of this, we believe the continued recovery of the US economy will prompt another wave of higher prices throughout the Q1:2021 earnings season. We believe a number of solid earnings and expectations will support the market and future expectations will support a continued moderate price rally in certain sectors.
The strongest sectors are going to continue to be the best performers over time. Being able to identify and trade these sectors is key to being able to efficiently target profits. You can learn more about the BAN strategy and how to identify and trade better sector setups by registering for our FREE webinar here. We’ve built this technology to help us identify the strongest and best trade setups in any market sector. Every day, we deliver these setups to our subscribers along with the BAN Trader Pro system trades. You owe it to yourself to see how simple it is to trade 30% to 40% of the time to generate incredible results.
For those who believe in the power of trading on relative strength, market cycles, and momentum but don’t have the time to do the research every day then my BAN Trader Pro newsletter service does all the work for you with daily market reports, research, and trade alerts. More frequent or experienced traders have been killing it trading options, ETFs, and stocks using my BAN Hotlist ranking the hottest ETFs, which is updated daily for my premium subscribers.
Happy Trading!
Chris Vermeulen
Founder & Chief Market Strategist
www.TheTechnicalTraders.com

