Bitcoin Enters Stage #4 Excess Phase Peak Breakdown – Where To Next?
Over the past few months, I’ve been interviewed in podcasts and on Kitco where I’ve discussed the US and global market setups and trends based on my unique understanding of Technical Analysis and price patterns. Even though I’ve heard/read some comments from viewers sharing their own opinions which may not always agree with my interpretation of the market setups, I like to let the market trends do their thing and ultimately someone will be proven correct at the end of the day. Today, we’ll revisit some research I completed back in November 2020 and see how that research played out to today with Bitcoin.
Attempting to predict any future trend in any market is a difficult task, to say the least. The markets do what they do and part of my experience is to understand technical analysis setups and the underlying psychological aspect to the market cycles. I’m never 100% accurate in my predictions or expectations either – no one is 100% accurate in predicting any future event. All we can do is try our best at identifying these setups and take trades when the opportunity strikes for profits.
Our November 27 Bitcoin Predictions Prove To Be Incredibly Accurate
On November 27, 2020, I published a research article that highlighted a fairly common pattern which I call the “Excess Phase Peak” and I highlighted a number of charts/setups at that time while warning readers that the current US/global market trends were entering a “blow-off” topping phase that would likely end in this type of Excess Phase Peak type of pattern. I also highlighted past Excess Phase Peak setups to provide clear examples.
Over the course of the last 6+ months, I’ve continued to share updates to the Bitcoin setup as it continued to progress through the different stages of the Excess Phase Peak setup. Most importantly, the breakdown at Stage #3 where the initial sideways flagging price trend breaks down – setting up the final support/floor in the markets before the last phase of selling takes place (Phase #5). You can read these published research articles (below):
- November 27, 2020: HOW TO SPOT THE END OF AN EXCESS PHASE – PART II
- May 20, 2021: BITCOIN COMPLETES PHASE #3 OF EXCESS PHASE TOP PATTERN – WHAT NEXT?
- June 22, 2021: BITCOIN IS NEAR THE BRINK OF BREAKING DOWN TO $30K – WILL IT STOP THERE OR WILL A ‘HERD MENTALITY’ SELL OFF DRAG IT TO $10K?
Excess Phase Peak Pattern Repeats – Creating Price Cycle Waves
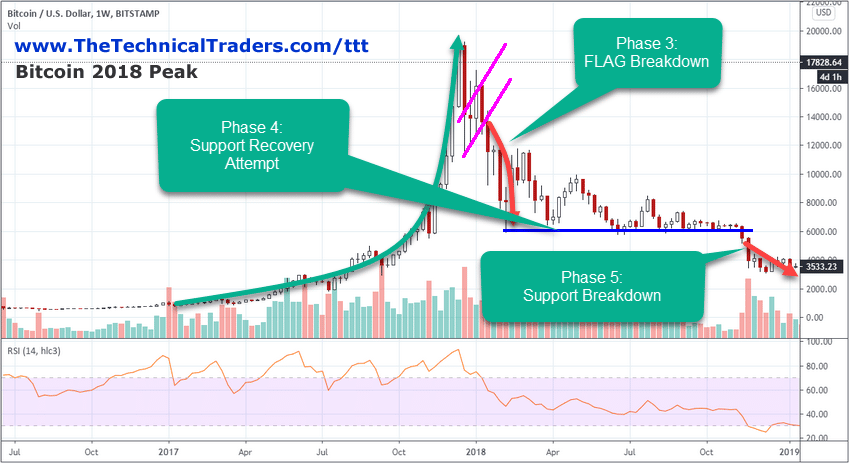
Let’s go back to the original chart from that November 27 article that started all of this. This chart highlighted the 2018 Bitcoin peak and how the Excess Phase Peak patter setup and progressed to an ultimate bottom in price.
I defined the structure/process of an Excess Phase Peak breakdown months ago as :
- The Excess Phase Rally must push price levels to new highs.
- A breakdown in price from the Excess Phase Peak sets up a FLAG/Pennant recovery phase. This represents the first attempt at a recovery that eventually fails.
- A breakdown in price from the FLAG/Pennant price recovery phase creates the real first opportunity for short traders or those that executed timely Put options. This represents the first real downward price trend after the FLAG setup.
- Phase 3 sets up the Intermediate-term support level. This becomes the last line of defense for price – an intermediate-term price floor. This phase can take quite a while to complete as traders often still believe a new rally will resume. Thus, this support level often has quite a bit of momentum to breakdown before it eventually fails.
- The final breakdown of price below the Phase 4 support level usually begins a much deeper sell-off. This is usually when other factors in the markets have finally resulted in the realization that the excess phase is over.
Initially, Phase #1 and Phase #2 are common setups within a price rally. What I feel is critical in confirming this Excess Phase Peak setup is the Phase #3 breakdown of the sideways price flagging pattern (#2), which will ultimately setup the lower intermediate support level. Once this Phase #2 breakdown takes place, that is enough confirmation for me to continue to believe that the Excess Phase Peak pattern will play out completely to ultimately establish some lower bottom in price.
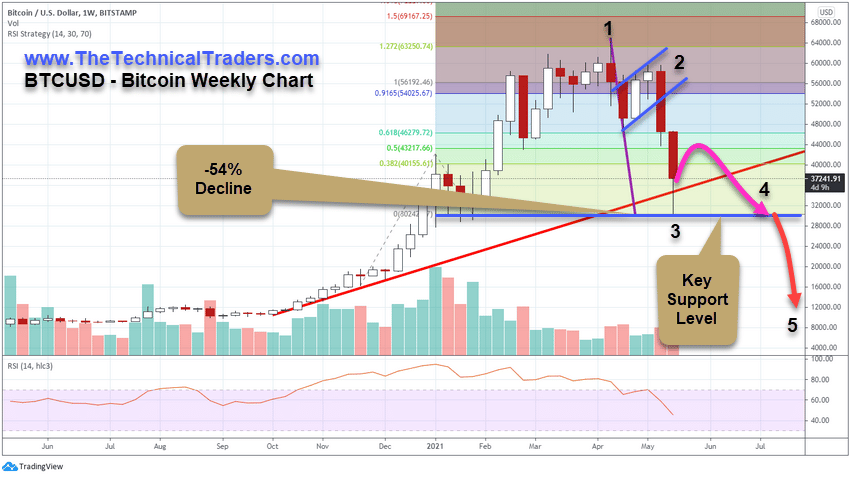
Current Bitcoin Breakdown Sets Up A Rush To The Final Bottom In Price
In this BTCUSD Weekly chart, we move to current price levels which highlight the breakdown of the Stage #4 Intermediate Support level (near $30,000). As continued price weakness pressures price to move below this critical $30,000 level, Bitcoin traders will start to shift their expectations once recent lows are breached near $28,600. Crypto traders are very strong believers in the ultimate upside targets of $100k or more and are often unable to see the downside risks associated with Technical Analysis setups and patterns.
Therefore, my team and I believe a flood of new selling pressure will initiate once the $28,000 level is breached to the downside. This is where Bitcoin traders suddenly shift away from the buy/hold position and start to reduce holdings because of downside risks. Those traders that purchased above $40k and are still holding, waiting for the rally, may want to reconsider their plans as the Excess Phase Peak pattern suggests. Phase #4 breakdown suggests an ultimate bottom level exists somewhere near between $9500 and $16,000 – a full -50% to -68% below the Stage #4 support level (near $30,000).
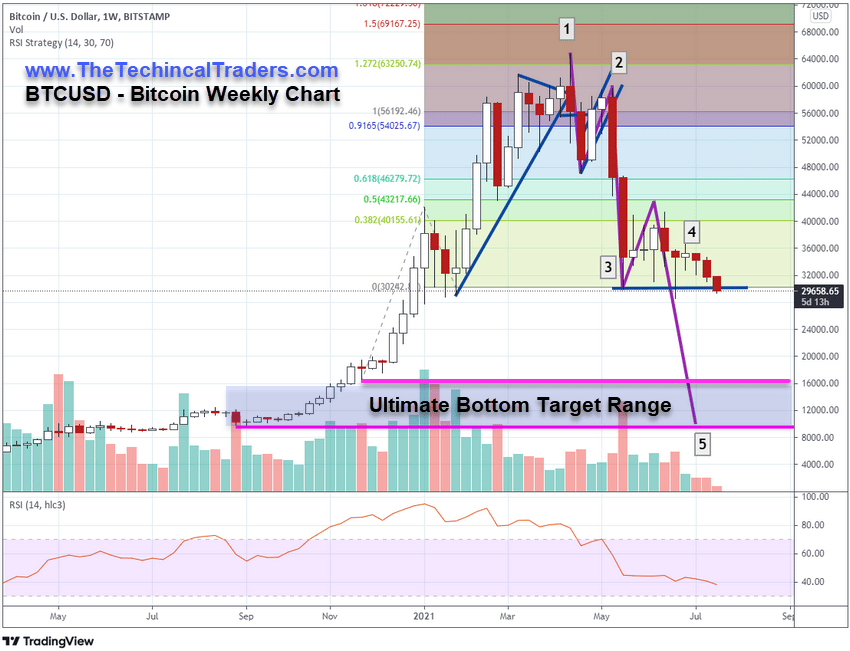
Eventually, price and selling pressure will dictate where the Ultimate Bottom will setup for Bitcoin. Our estimate of a $9500 to $16,000 bottom target range is based on the initial support level setup in September/October 2020. If this level is breached as selling pressure may continue to drive price levels much lower, then we would fall back to the next key low in price from March 2020, near $3,850.
Sign up for my free trading newsletter so you don’t miss the next opportunity!
While a collapse to $3,850 would certainly burst a lot of enthusiasm for Bitcoin and the $100k expected bullish price target level everyone believes will eventually happen, we, as Technical Analysts, believe the current Phase #4 breakdown is just starting and any of these ultimate downside targets are very valid levels for price to attempt to find some future support.
In closing, I want to urge Bitcoin and Crypto traders to understand these setups and trends because you will see them in the future. Be aware of the setups, phases, and trends that are likely to develop within this pattern and learn to use them to your advantage. I’m excited to get back onto the recent podcasts, interviews, and get invited back to Kitco again to discuss this current breakdown in Bitcoin. In most cases, you just have to identify the setups/phases of market trends let the market trend tell you what to expect – instead of trying to “hope” for an unrealistic outcome.
Want to know how our BAN strategy is identifying and ranking various sectors and ETFs for the best possible opportunities for future profits? Please take a minute to learn about my BAN Trader Pro newsletter service and how it can help you identify and trade better sector setups. My team and I have built this strategy to help us identify the strongest and best trade setups in any market sector. Every day, we deliver these setups to our subscribers along with the BAN Trader Pro system trades. You owe it to yourself to see how simple it is to trade 30% to 40% of the time to generate incredible results.
As something entirely new, check out my new initiative URLYstart to learn more about the youth entrepreneurship program I am developing. This is an online program of gamified entrepreneurship designed to introduce and inspire kids to start their own business. Click-by-click, each student will be guided from their initial idea, through the startup process all the way to their first sale and beyond. Along the way, our students will learn life lessons such as communication, perseverance, goal setting, teamwork, and more. My team and I are passionate about this project and want to reach as many kids as possible!
Have a great day!
Chris Vermeulen
Chief Market Strategist
www.TheTechnicalTraders.com