Crude Oil Collapses Overnight On Supply Glut And Fractal Analysis Say $7 is Support
Crude Oil continues to be a big mover as the supply glut has really pushed global capacity to its limits. Dozens of full tanker ships are anchored off the California and Singapore coastlines waiting for demand to pick up. As long as the Virus shutdown persists globally, the supply gut will continue to wreak havoc on oil price levels into Summer. As of early Monday morning, Crude Oil is lower by -17% to $14.10 as I type.
What most readers of our articles here don’t fully grasp is just how accurate our long-term predictions truly are and its why we link to past research posts that clearly prove our analysis can be deadly accurate.
You may remember our incredible research post from July 2019 which suggested Crude Oil would collapse in early 2020 calling out a potential $14 price target.
You may also like to review our warning from January 2019 related to Oil and Energy. We also predicted the gold bullion breakout and bull market to happen last year in April, May, or June, which is it, and we called that six months prior. Eric Sprott talked about our gold prediction and how much he liked out analysis on his podcast back then.
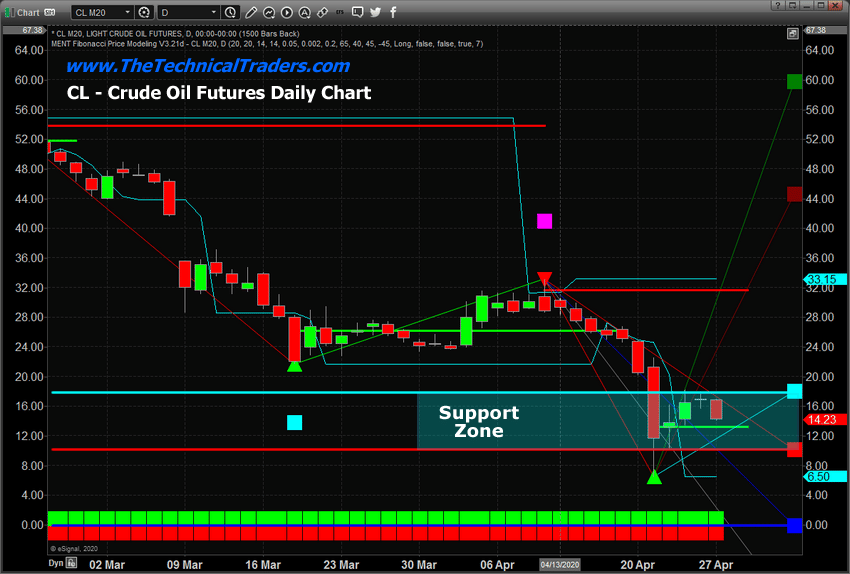
Our Adaptive Fibonacci price modeling system is suggesting a support zone near $9 to $18 may become a new sideways trading zone for Crude Oil. We believe the downside risk to price levels is still excessive, but we also believe that true price valuation levels will keep Oil above $4 ppb as global demand will eventually recover. Thus, we believe Oil will likely settle into a sideways price range between $9 and $18 as this virus event continues. It may attempt brief moves outside these ranges but eventually, settle back into this range until true demand begins to accelerate higher.
Before we continue, be sure to opt-in to our free market trend signals
before closing this page, so you don’t miss our next special report!
Daily Crude Oil Chart
Adaptive Fibonacci Price Modeling
This Daily Crude Oil Chart highlights our Adaptive Fibonacci Price Modeling system’s results and clearly shows the Support Zone. We believe this Zone will become a new sideways price channel for Crude oil.

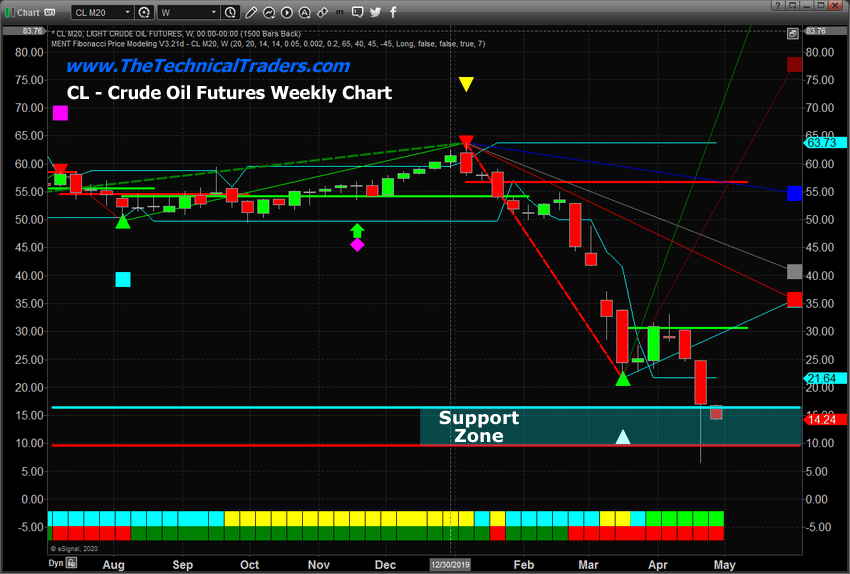
Weekly Crude Oil Price Chart – Support Zone
This Weekly Crude Oil Price chart also highlights the Support Zone. The potential for Crude prices to retest the $7 to $8 price range based on this massive supply glut is not out of the question. We believe Crude Oil will settle into the Support Zone while attempting to establish a price bottom near $7 or $8 over the next 90+ days. It may become an extended sideways bottom/flag formation as the bottom forms.

Our suggestion is to expect a more sideways bottom formation in Crude Oil over the next 60 to 90+ days. The supply-side glut is really pushing price levels down to extreme levels. Nothing will change that aspect of the market dynamic until we exit this Virus shut-down and demand starts to skyrocket higher. That may come in August or later in the year.
We do believe Oil will attempt to find support above $7 to $8 ppb as we believe the supply glut will push oil prices to a “core value level” where global buyers will attempt to say “we can’t sell oil at anything less than $x.xx”. We believe that level is $7 to $8 ppb overall.
As a technical analyst and trader since 1997, I have been through a few bull/bear market cycles in stocks and commodities. I believe I have a good pulse on the market and timing key turning points for investing and short-term swing traders. 2020 is an incredible year for traders and investors. Don’t miss all the incredible trends and trade setups.
We all have trading accounts, and while our trading accounts are important, what is even more important are our long-term investment and retirement accounts. Why? Because they are, in most cases, our largest store of wealth other than our homes, and if they are not protected during a time like this, you could lose 25-50% or more of your entire net worth. The good news is we can preserve and even grow our long term capital when things get ugly like they are now and ill show you how and one of the best trades is one your financial advisor will never let you do because they do not make money from the trade/position.
If you have any type of retirement account and are looking for signals when to own equities, bonds, or cash, be sure to become a member of my Long-Term Investing Signals which we issued a new signal for subscribers.
Subscribers of my ETF trading newsletter had our trading accounts close at a new high watermark. We not only exited the equities market as it started to roll over in February, but we profited from the sell-off in a very controlled way with TLT bonds for a 20% gain. This week we closed out SPY ETF trade taking advantage of this bounce and entered a new trade with our account is at another all-time high value.
Ride my coattails as I navigate these financial markets and build wealth while others watch most of their retirement funds drop 35-65% during the next financial crisis.
Chris Vermeulen
Chief Market Strategies
Founder of Technical Traders Ltd.

