Yield Curve 101 – Steep, Flat, Inverted – What’s The Difference?
The yield curve plots the current yield of a range of government notes and bonds in the “primary market.” The worldwide bond market – including private and government debt — currently represents about $120 trillion in outstanding obligations. The United States accounts for roughly $46 trillion (39%).
The U.S. government finances its spending by collecting taxes and issuing debt. More specifically, the U.S. Treasury funds deficit spending by issuing debt instruments with a range of maturities.
- Treasury Bills have maturities from one month to one year.
- Treasury Notes have maturities from two to ten years.
- Very long-term debt is issued as Treasury Bonds with 20- and 30-year maturities.
Treasury yields rise and fall depending on demand and expectations for the economy over various timeframes. Competitive bidders set yields in a “primary market” auction process with an inverse relationship between prices and yield. Note that market participants, not the U.S. Federal Reserve (a.k.a. Fed), determine these prices and yields. The Fed sets a target for a very short-term (overnight) Fed Funds Rate and a Discount Rate. Their policy of lowering or raising those rates holds significant influence but does not have direct control over the debt auctioning process.
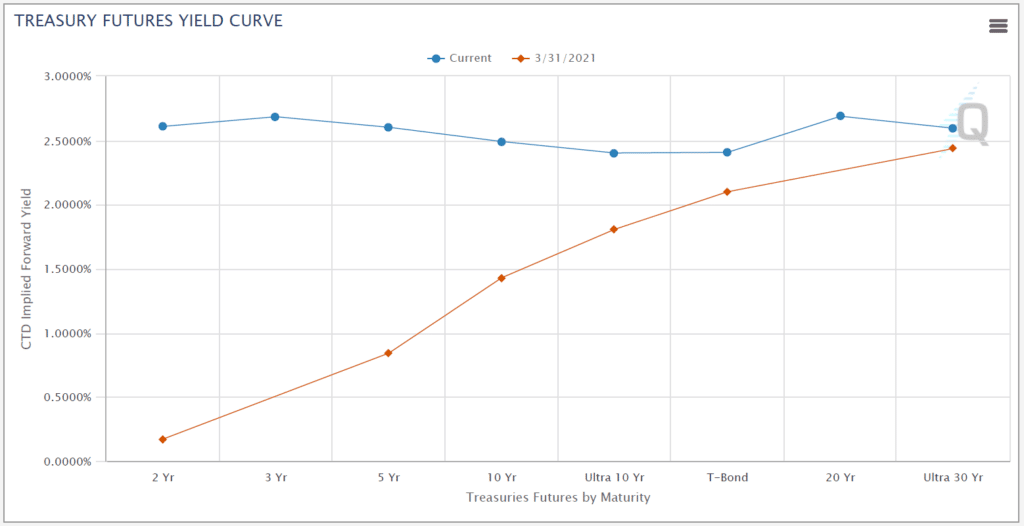
Here’s a U.S. yield curve plot showing both a normal and an inverted curve. The red line shows what is typically viewed as a “normal” curve where longer-term debt has a higher yield than shorter-term debt. That reflects a view that inflation will erode returns over a longer period, and therefore, a higher yield is expected. The blue line shows an inverted curve where shorter-term debt has a higher yield than longer-term.

Why Does the Curve Invert?
The yield curve is typically described as steepening, flattening, or inverting.
A steep curve reflects expectations of higher inflation and interest rates that come with a more robust economy.
The curve typically flattens or even inverts when Fed policy is in a tightening cycle of raising rates in the near term. That implies that investors have less confidence in the longer-term economic outlook and expect that the Fed may have to cut rates at some point in the future to stimulate the economy.
What Does an Inverted Curve Mean?
In the past 60 years, every U.S recession has been preceded by at least a partially inverted yield curve. That delay has ranged between 6 and 36 months with an average of 22 months.
But every yield curve inversion has not been followed by a recession. As a predictor of a recession, an inverted yield curve suggests but does not guarantee a recession.
Remember that a recession is technically defined as two successive quarters of negative GDP growth. There can undoubtedly be economic slowdowns that are shallow and temporary that do not qualify as a full-blown recession.
Perhaps it’s more accurate to say that an inverted yield curve is a relatively reliable predictor of an economic slowdown but not necessarily a recession.
Is it Different This Time?
Maybe. Over the last two years, the Fed took a very unusual step of implementing “Quantitative Easing” to stimulate economic recovery after the “Covid Crash” in March 2020. The Fed has been adding to its balance sheet by buying longer-dated bonds. As the economy has strengthened, the Fed has announced that it will shift to selling bonds to reduce its balance sheet.
Many observers think that this action by the Fed has kept the long-term yields — in particular, the 10-year — artificially low, and those yields are likely to rebound when the Fed stops selling its excess. If that were to happen, then the yield curve could suddenly steepen.
Sign up for my free trading newsletter so you don’t miss the next opportunity!
There’s also debate over which parts of the yield curve to compare. Historically, comparing the 2- and 10-year yields (the “2/10”) has been a widely used benchmark. Some observers say comparing 3-month and 10-year yields is a better indicator. And without an inversion in the 3mo/10yr, there is much more doubt about an imminent recession.
What Does This Mean for Stocks?
We shouldn’t make investing decisions based just on the yield curve discussion. It’s certainly interesting and it may well be a predictor of an economic slowdown if not a recession. But it is only one piece of a many-pieced puzzle.
As a trader and investor, I focus more on technical indicators of stock price action and stock index valuations. Even in a recession, some sectors do well while others do poorly. Money is always moving. That’s the ball that I’m keeping my eye on.
want To Learn More About Options Trading?
Every day on Options Trading Signals, we do defined risk trades that protect us from black swan events 24/7. Many may think that is what stop losses are for. Well, remember the markets are only open about 1/3 of the hours in a day. Therefore, a stop loss only protects you for 1/3 of each day. Stocks can gap up or down. With options, you are always protected because we do defined risk in a spread. We cover with multiple legs, which are always on once you own.
If you are new to trading or have been trading stock but are interested in options, you can find more information at The Technical Traders – Options Trading Signals Service. The head Options Trading Specialist Brian Benson, who has been trading options for almost 20 years, sends out real live trade alerts on actual trades, such as TSLA and NVDA, with real money. Ready to subscribe, click here: TheTechnicalTraders.com.
Enjoy your day!
Chris Vermeulen
Founder & Chief Market Strategist
TheTechnicalTraders.com

