OIL – What to expect within the first 3~5 months of 2019
As we near the end of 2018 and have recently witnessed an incredible price rotation in the US stock market, it is time for traders to take stock of the incredible opportunities that are set up for early 2019 and beyond. Our research team, at www.TheTechnicalTraders.com, has put together some truly incredible longer-term Adaptive Dynamic Learning (ADL) predictive price modeling system charts that will help you understand and identify incredible opportunities that should play out in early 2019. We know you will not find this type of analysis anywhere else on the planet and we know just how valuable these charts are too skilled traders. So, get ready for some incredible moves – as impossible as they may seem.
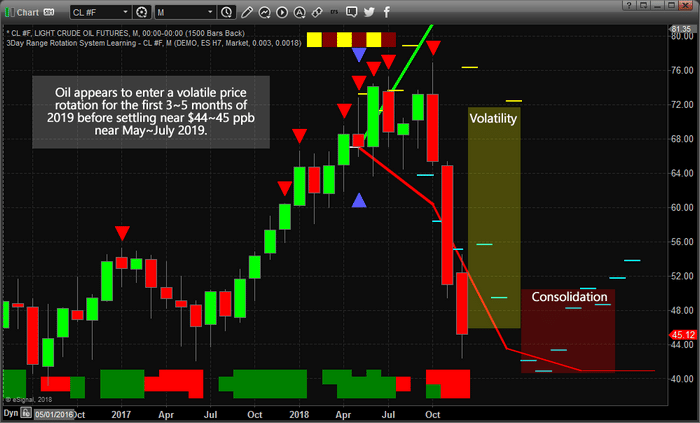
Let’s get started with Crude Oil. This Monthly chart of Crude showing our ADL price modeling system is clearly indicating the first few months of 2019 will include increased price volatility. One thing to pay attention to as we review these charts are the BLUE TRIANGLES, which is where we asked the ADL predictive modeling system for a detailed analysis, and the CYAN, YELLOW, and WHITE DASHED LINES, which is where the ADL system is showing us the highest probability price outcome into the future. On this chart, we can see that the predicted price levels of the past have been relatively close to where the price has closed on each monthly price bar. Going into the future, we can see 3~4 months of price volatility between $50 and $65 (roughly) with rotating higher/lower price objectives. We interpret this as greatly increased price volatility with the potential of supply events disrupting global expectations in oil. These could be intermediate-term price rotations that keep the price within our $50~65 price range, or they could be large range, very dramatic price rotations as a result of massive global supply events.
What we can suggest to you, today, is that early 2019 should provide some very interesting short to intermediate term price triggers in Oil before price settles back below $50 near June or July 2019.
Additionally, if this analysis is correct, the US stock market may, very quickly, rally to attempt to establish new all-time highs again in early 2019. This move could happen well before May or June 2019. Be prepared for this move because, currently, there are a bunch of shorts that are predicting a 1929 style market crash. Those shorts are going to get crushed in a massive short squeeze if our ADL predictive modeling results are accurate.
This incredible setup and opportunities for skilled traders can only be found with our proprietary Adaptive Dynamic Learning (ADL) predictive modeling tool. Call it a New Year’s gift or whatever you want to call it. Within this research article, we’ve shown you what we believe are some of the most incredible trading setups to start 2019 and we’re confident in our model’s ability to accurately find and call these moves. Want to learn what other setups our predictive cycle, Fibonacci and ADL systems are showing us? Want to know what the metals are going to do in 2019? Want to know which sectors are going to move and when? Visit www.TheTechnicalTraders.com to learn how we help our members find and execute better trades. Visit www.TheTechnicalTraders.com/FreeResearch/ to review some of our earlier research posts and to see how we’ve been calling these moves accurately for months.
Want to make 2019 a great year with incredible opportunities for success? Join our other members at www.TheTechnicalTraders.com today and make 2019 an incredibly successful year.
Chris Vermeulen