Us Stocks Seem To Be Following Our Predictions – Get Ready (Part I)
As we near the important date of August 19, 2019, and we watch how the markets are reacting based on our earlier predictions, it is becoming evident that the US stock markets and global stock markets are following our predictions very well. The fact that these markets are doing almost exactly what we predicted months ago suggests that our call for an August 19, 2019 breakdown in the US/Global markets should also align with price activity very well.
This Q2 earnings week and the continued shifting of capital withing the global markets are suggesting a couple of things that traders need to be aware of :
_ Quite a bit of capital has already been pulled out of the global markets over the past 60+ days.
_ The US Fed has hinted that a rate decrease may be in the works over the next few months – suggesting that the Fed is more concerned with increasing economic activity than further normalization efforts.
_ China, Asia, and Europe continue to deal with slumping economic activity, demand and output.
_ Deutsche Bank is an unknown factor that could turn into a black-hole for the global banking system
_ Global derivatives activities have decreased tremendously over the past 15+ months.
We suggest that everyone take a few minutes to review these recent research posts to better understand what is actually happening in the US/global markets.
– NASDAQ Targeting 8031 Forecast
– PART II – Global Debt Crisis
– Earning Surprises- Watch Out!
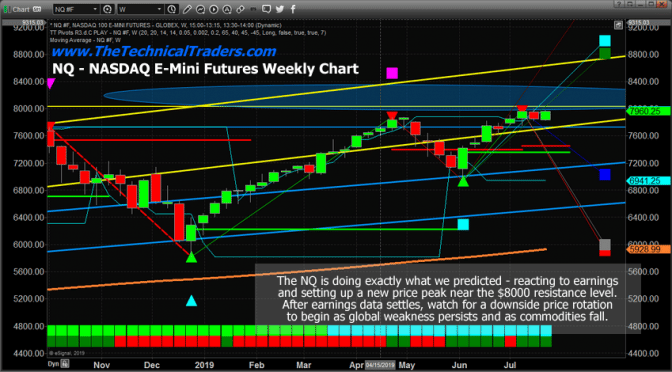
Our belief that the US stock market would continue to push higher while attempting to break key psychological price levels has played out perfectly. The recent Q2 earnings data has accomplished just what we expected – a continued upside price bias with moderate volume. This move has pushed the VIX into a lower basing pattern and we believe the NQ may attempt to rally to levels above $8000 again (after breaching this level on July 16).
The key to everything our predictive modeling systems are suggesting is a “rollover in investor sentiment” that is likely to take place after Q2 earnings data is completed and in the midst of an August (Summer) slump in economic activity. Our predictive modeling systems and cycle analysis tools have suggested that the US markets will find unexpected weakness starting in early August, peaking near August 19 (which is when we expect a breakdown event to occur) and continuing for many months after this move begins.
We believe this downside price move will be associated with some type of external economic impulse – such as a collapsing banking/debt sector in China, news of a hard Brexit taking place, a Deutsche Bank collapse or some type of external event that will prompt this downside price move.
As volatility continues to expand while capital is being pulled out of the markets, this creates a VOID of liquidity when an event like this takes place (similar to what happened during the Flash Crash event). Traders should be very cautious right now because all of the evidence that we’ve been able to find suggest institutional level players have already scaled out of the markets and move into protective investments. Thus, any real breakdown in the markets could be vicious and aggressive at this point.
This Weekly NASDAQ Futures Chart highlights the BLUE ELLIPSE resistance level that price is currently testing. It is our belief that price will run into extreme resistance at this level and roll-over into a downtrend over the next 30+ days. Our Fibonacci price modeling system is suggesting a downside target of 7000, 6000 and 5910. The deepest of these levels align almost perfectly with the lows from December 2018 – a -25% price decline.
CONCLUDING THOUGHTS:
Do you want to know where other opportunities can be found based on this NQ prediction? Are you ready for these types of great trade setups for the rest of 2019 and into 2020? In part II of this article, we’ll highlight two more great trade setups that align with our expectations for the US and global markets.
You should be starting to get a feel of where stocks are headed along with precious metals for the next 8-24 months. The next step is knowing when and what to buy and sell as these turning points take place, and this is the hard part. If you want someone to guide you through the next 12-24 months complete with detailed market analysis and trade alerts (entry, targets and exit price levels) join my ETF Trading Newsletter.
Be prepared for these incredible price swings before they happen and learn how you can identify and trade these fantastic trading opportunities in 2019, 2020, and beyond with our Wealth Building & Global Financial Reset Newsletter. You won’t want to miss this big move, folks. As you can see from our research, everything has been setting up for this move for many months.
Join me with a 1 or 2-year subscription to lock in the lowest rate possible and ride my coattails as I navigate these financial market and build wealth while others lose nearly everything they own during the next financial crisis.
As a technical analysis and trader since 1997, I have been through a few bull/bear market cycles. I believe I have a good pulse on the market and timing key turning points for both short-term swing trading and long-term investment capital. The opportunities starting to present themselves will be life-changing if handled properly.
FREE GOLD OR SILVER WITH MEMBERSHIP!

Kill two birds with one stone and subscribe for two years to get your FREE PRECIOUS METAL and get enough trades to profit through the next metals bull market and financial crisis!
Chris Vermeulen – www.TheTechnicalTraders.com