US Markets “Roll Over” On Earnings and Economic Data At Channel Highs
As we near the end of October 2019, a very interesting price setup is taking place across many of the US market sectors recently. We only have a total of about seven trading days left in October 2019 and the Financial Sector ETF is rolling over with what appears to be an Engulfing Bearish price pattern near price channel highs. Additionally, the tech-heavy NASDAQ (NQ) has been mostly weaker compared to the ES and YM.
On September 30, 2019, we published this research post that highlighted why our predictive modeling systems suggested the S&P 500 and NASDAQ market sectors would become much more volatile than the Dow Jones Industrials: MODELING SUGGESTS BROAD MARKET ROTATION IN THE NQ & ES.
We believe this research is still very valid given the current price rotation near these price channel highs and given the potential that the Dow Jones stocks may become relatively stronger alternatives than the S&P 500 and NASDAQ sector stocks.
We believe a downside price rotation is setting up in the US and global stock markets and we believe the potential for large price moves exists in at-risk sectors like the Financials, Technology, Biotech, Energy, Services and other sectors that do not directly relate to what we feel are “essential consumer staples”. The Dow Jones Industrials Index is full of companies that traditionally perform better in a consumer-based economic contraction for investors – which is why we believe the YM will present a very unique opportunity going forward for skilled traders.
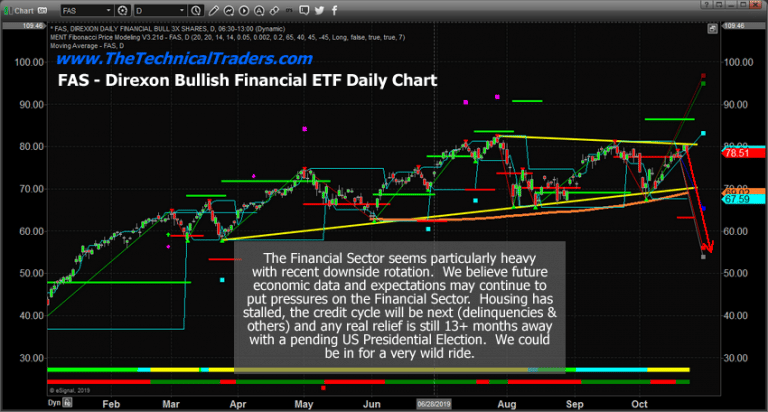
FAS Daily Chart, the Direxion Financial Bull ETF
This first FAS Daily Chart, the Direxion Financial BULL ETF highlights the price channel in YELLOW and highlights the recent price rotation near the $80 price level which constitutes a potential “new lower high” price rotation. Our longer-term cycle analysis tools predict a downside price move initiating over the next 7 to 10 trading days. We believe this new downside price trend could push price levels below the lower price channel level if this move is associated with external news or economic data that panics the markets.
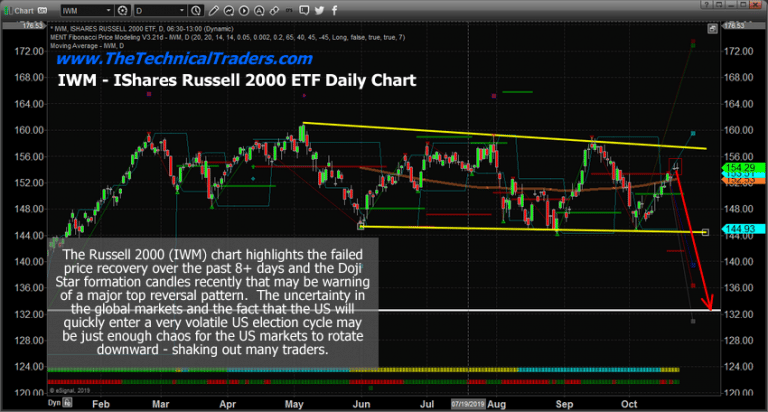
IWM, Russell 2000 ETF, Daily Chart
This IWM, Russell 2000 ETF, Daily chart highlights an “island Doji top” formation that is setting up as a very unique price formation. When Doji type candles form with a gap above the previous bars, this is often considered an “island top” type of formation. Doji candles represent indecision and uncertainty. They are often found near-critical top and bottom formation. In this current formation, we believe the island top formation is a very clear warning that a major price top is setting up in the Mid-Caps which would also be considered a “new failed price high” formation. Ultimately, the $144.50 level becomes critical support if price falls.
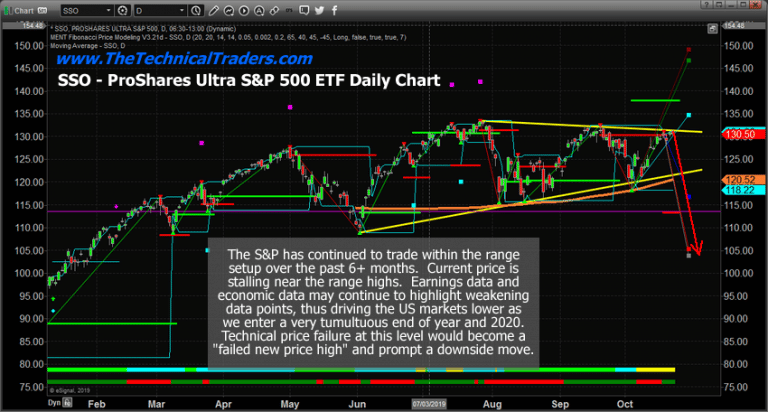
SSO, ProShares Ultra S&P 500 ETF, Daily Chart
This SSO, ProShares Ultra S&P 500 ETF, Daily chart highlights a similar price range setup. Notice how all of these sectors have rotated into these ranges over the past few months – very similar to what happened in 2015/16 prior to the 2016 elections. We believe the uncertainty related to global trade, global economics and the US political “circus” will continue to put pricing pressure on the US stock market and global markets. We believe the inability to achieve “new price highs” throughout many sectors is a very clear warning that a larger downside price move, a type of price reversion, maybe setting up and we have been trying to warn our followers to be very cautious in taking unnecessary risks at this time while trading.
If our cycle research and predictive modeling systems are correct, we could be setting up for a downside price move that may act as a “true price exploration/reversion event” and potentially target levels that may be below the June 2019 lows. If this move is associated with some external news event or global crisis event, we may see prices fall to levels below the December 2018 low price levels.
Overall, we urge all skilled technical traders to stay very cautious over the next few months. Target solid trades that present very clear opportunities and properly position your trades to attempt to mitigate unknown risks. This is not the time to go “all-in” on anything as the markets are far more capable of being irrational than you are likely to be able to handle the risks that are associated with a crazy market move.
As a technical analysis and trader since 1997, I have been through a few bull/bear market cycles. I believe I have a good pulse on the market and timing key turning points for both short-term swing trading and long-term investment capital. The opportunities are massive/life-changing if handled properly.
I urge you visit my ETF Wealth Building Newsletter and if you like what I offer, join me with the 1-year subscription to lock in the lowest rate possible and ride my coattails as I navigate these financial market and build wealth while others lose nearly everything they own during the next financial crisis. Join Now and Get a Free 1oz Silver Bar!
Chris Vermeulen
www.TheTechnicalTraders.com
NOTICE: Our free research does not constitute a trade recommendation or solicitation for our readers to take any action regarding this research. It is provided for educational purposes only. Our research team produces these research articles to share information with our followers/readers in an effort to try to keep you well informed. Visit our web site to learn how to take advantage of our members-only research and trading signals.
