US Markets Rally Hard – Could Another Big Upside Leg Begin?
Closing out the first week in June 2019, the US stock market rallied hard from recent lows and prompted many traders/investors to rethink their future plans. At the same time, Gold and Silver began a decent price rally of their own while Oil found support just above $50. It certainly has been an interesting week for traders. One that was full of incredible opportunity as many symbols rotated 6 to 12% or more over the past 10+ days.
The fact that Oil is finding support above $50 while Gold and Silver continue to rally suggests that fear may be entering the metals market while Oil may have found a temporary price bottom near $50 to $51. Weakness in the US Dollar is also helping both Oil and Metals to push higher. Our recent research suggests that the US Dollar will find support near $95 indicates the US Dollar may fall a bit further – pushing Oil and Metals a bit higher.
The strength in the US stock market near the end of the week suggests fear of any US collapse or future economic concerns appears to be abated. It is very unlikely the US major indexes would rally as they have on any extreme fear of any major US calamity or economic concerns. A slightly weakening US Dollar and moderately strong US economic data continues to suggest the US stock market may continue to be the repository of funds for foreign investors for many years to come – or until something dramatic changes in the US.
It is rather simple to understand the capital process that is at work in the global economy at the moment; until foreign market valuations and expectations appear to be opportunistic for future returns, the US Dollar and the US stock market are the most likely targets for foreign investment and safety. Weakening currencies, weakening global economies and weakening commodity prices will push capital away from foreign markets and into safety. Safety will be found in the US markets, precious metals and possibly Crypto currencies. Anything that avoids deflationary risks and credit/debt risks.
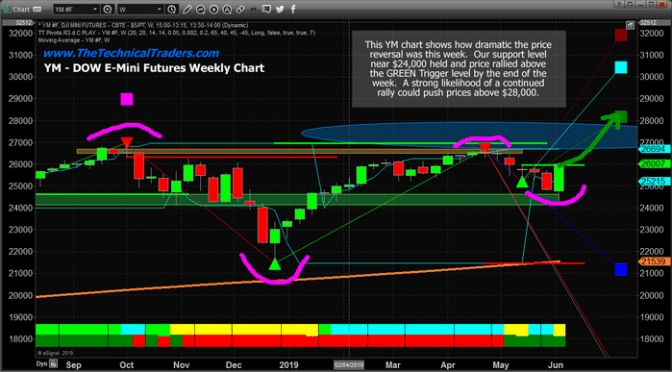
This YM Weekly chart highlighting our Fibonacci price modeling system shows how dramatic the upside price reversal was by the end of last week. The closing candles created an Engulfing Bullish candlestick pattern which is typically quite bullish. The fact that price closed above the GREEN Fibonacci trigger level is further indication that a renewed price rally may begin soon. Support near $24,000 appears to be quite strong and any further downside price risk must first break this level. As long as support holds and price continues an upside bias, there is a very strong potential for a move to above $28,000 in the works.

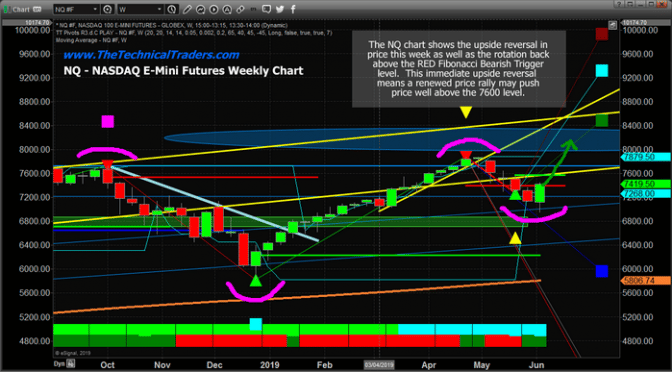
This NQ chart highlights a similar price pattern and suggests the NQ needs to climb above $7600 before a true rally can begin. Ultimately, the upside targets for this move are near $8500 or higher based on current price rotation. Support near $6800 is critical – so price must stay above this level for any future rally to continue.

We authored a VIX/Volatility article just a few days ago that highlighted our belief that the VIX would trade lower, within a sideways price channel till near the end of July or August 2019 – then begin another VIX Spike move upward. This coincides with the current research we are seeing where the US stock market will likely continue to push higher, very possibly setting new all-time highs again before any real risk of any downside price collapse happens.
In fact, there are several super cycles starting to take place and we head into 2020 and beyond which Brad Matheny and layout in our new book: 2020 Cycles – The Greatest Opportunity Of Your Lifetime
Follow our research and don’t miss these opportunities. We’ve been warning our followers for months that 2019 and 2020 are going to be incredible years for skilled traders. These recent 10 to 20% moves in Gold, Silver, Oil and many ETFs are just the beginning. Our research team and trading team are ready to help you find and execute for better success.
Chris Vermeulen
www.TheTechnicalTraders.com

