Transportation Sector Crashed Hard and What it Means
The Transportation Index, a common measure of economic optimism or pessimism, collapsed very early in trading after the Martin Luther King holiday (January 20, 22020). We found this very informative because a rotation like this suggests optimism may be waning by global investors and future expectations of growing economic activity may be reverting to more realistic expectations headed into a US election year on top of the US political circus.
When we take a look at these TRAN charts, below, pay very special attention to the historical upper range of price activity over the past 20+ months and you’ll see why we believe a top formation/setup near these current levels in the TRAN could be a very strong topping pattern for the US and Global markets.
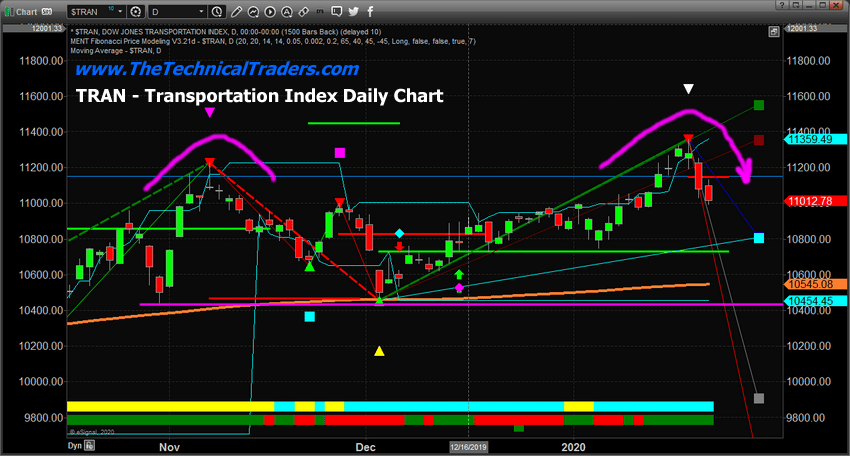
Daily Transportation Chart
This Daily Transportation chart highlights the immediate rotation that is setting up a sideways price channel. The range between 11,250 and 10,450 has established a moderately strong sideways price channel going back well over 3+ months in the Transportation Index. The broader price channel, between 11,250 and 9,700, extends well over 8+ months. Beyond that, we have a rotation going all the way back into 2018, between 11,600 and 8,650, that establishes a very broad sideways price channel.
The Transportation Index has been trading within this sideways price channel over the past 20+ months as global investors attempt to determine the future expectations for the US and global economies. If global investors believe the economy will accelerate as consumers become more active, then the Transportation Index will rise above the 11,800 level on an upside breakout move. If global investors believe the US and global economies will contract before experiencing any further advance, then the Transportation Index will likely fall to levels below 10,400 – possibly lower.

The recent downside rotation in the TRAN suggests global investors and skilled traders are not expecting the economy to continue as it has over the past 6 to 12+ months – as the US stock market. The melt-up in the US stock market was a result of global capital attempting to take advantage of a stronger US Dollar and continued price appreciation in the NASDAQ and various US stock sectors. Even though the underlying economic data and fundamentals may not have changed, it was still advantageous for global investors/traders to play the “melt-up” because it provided the opportunity to gain on two fronts – US Dollar gains and US share price gains.
If this massive “capital shift” trade is unwinding, in part or in full, then we will start to see weakness in the Transportation Index and likely the Mid-Caps as global investors try to pull away from risks in the US stock market. If the Transportation Index falls below 10,450, then we need to get ready for a potentially bigger downside price move across the global markets.
Weekly Transportation Chart
This Weekly TRAN chart highlights our Adaptive Fibonacci price modeling system which has drawn the GREEN and RED “trigger levels” above and below the current price action. It is doing this because the TRAN price action has not defined any real price trends recently – staying within the sideways price channel. The price must either rally above 11,450 to begin a new bullish price trend or fall below 8,990 to initiate a new bearish price trend. That means a downside price rotation may support a -2000 point decline from current levels before initiating a continued downside Bearish global market trend.

It is time to really start paying attention to what happens with the Transportation Index. First, we have to watch the 10,400 level. Then we have to watch the 9,700 level. If both of those fail, then we have to watch the 8,990 level as the final “trigger level” for a new global market bearish trend. We are a long way away from that moment right now, but it appears the Transportation Index has started to revert back to the downside and we are alerting our friends and followers to be aware this rotation may be a very timely warning of a new global market top in the making.
Utility Sector Warns of Big Money
Is Exiting The Market
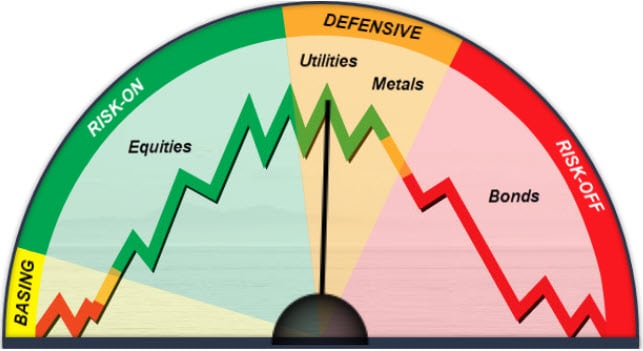
Utility stocks have been on fire ripping to the upside and they tend to lead precious metals and then bonds so I am starting to get excited for our portfolio.
We locked in 10% the 3rd quarter of our SSO position today, we still have 25% of that initial position left but our exposure to equities is now very small. All the other asset classes like high yield bonds, gold, and utilities are pointing to a correction in the stock market.
You can see which markets do well at various stages of risk in the market using our custom market gauge we have been developing. This is one of the new trading tools have been working on.
This gauge will automatically update live with the markets using all of our analyses. Its a really exciting new tool we plan to make available in the next 30 days for our subscribers.
BIG MONEY FLOW GAUGE
20-40 Day Market Price Cycle

Join my Wealth Building Newsletter if you like what you read here and ride my coattails as I navigate these financial markets and build wealth while others lose nearly everything they own.
Chris Vermeulen
www.TheTechnicalTraders.com

