The Shake-Out Continues – Where Is The Bottom?
Smart traders are already asking themselves “where is the bottom for this move”. They’ve likely been through these types of rotations in market price before and understand the fundamentals of the US economy are strong enough to support further upside price activity in the near future. The current US/China trade worries could result in a pricing disruption of 4 to 8%, seen as rotation, yet the US Fed is continuing to leave rates unchanged and most US economic numbers are still posting strong levels.
So, smart traders want to know where the bottom in the market is likely to be found and when they should start to accumulate new long positions – which is understandable. We’re here to help.
Our proprietary Fibonacci price modeling system is one of the unique modeling tools we use to hone into any market move. The reason for this is because it shows us so much data that we can “read into” our analysis/research. The other reason is that it is an “adaptive learning” model – which means it continues to learn from price data and adapt its analysis of that data.
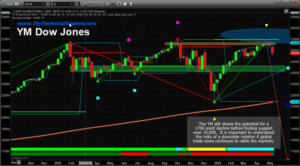
Let’s start with the Weekly YM chart. The GREEN highlighted box on this chart shows where the past two Bullish Fibonacci price trigger levels were generated. These, obviously, become key support levels going forward. The narrow ORANGE box near the current peak is the resistance channel we highlighted many weeks ago that suggested a volatility rotation peak may be setting up. We have also drawn an oblique/circle on the chart in BLUE that highlights upside Fibonacci target price levels.
It is our opinion that a further downside leg, possibly to levels below $25,000, are possible as this Shake-Out continues and as the global markets continue to revalue expectations. We are watching the currencies very closely as the Chinese Yuan has devalued extensively over the past few days. This US Dollar strength will keep metals fairly flat while prompting some extra stability in the US stock market over time.
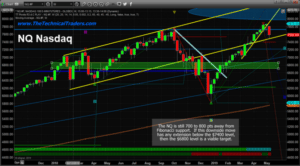
This next chart, the NQ Weekly, shows a similar chart format to that of the YM. Clear resistance can be seen near the recent highs and support is found near the $6600 level from previous Fibonacci Bullish Price Trigger Levels. The NQ, being very heavily weighted in Technology and Internet stocks, may have the ability to fall the furthest within this price rotation – possibly as much as -700 to -800 pts before finding support. Currently, a support level near $7400 is the first level we are watching. If the NQ breaks below this level, then we could see a much bigger move to the downside unfold fairly quickly.
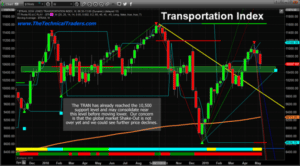
Lastly, the Transportation Index (TRAN) is showing us that the downside price move may have already reached a level that may prompt intermediate price support – or a potential base formation. The $10,400 to $10,500 level, which was already reached, appears to be the initial support level for the TRAN. It would make sense that the TRAN may begin to base near this level over the next few days/weeks while the US stock market attempts to hammer out a bottom.
Ultimately, the $10,000 level has proven to be very strong historical support for the TRAN. So any breakdown in this index would immediately prompt a target level of $10,000 for the next support level. Again, pay attention to the US Dollar and Gold as this movement continues. Any real fear will translate into a weaker US Dollar and increasing prices in precious metals.
In closing, we believe the early signs of a potential price bottom are setting up right now. This may not be the ultimate bottom, but the clear support level in the TRAN is a very good sign that the markets are setting up a support base that may prompt some sideways trading over the next few weeks as the market continues to digest all this global trade news. A deeper “washout-low” price formation may set up in the INDU or the NQ over the next few days which means we may see a deeper price rotation before the downtrend actually ends.
Right now, pay attention to our continued research and we’ll help you find the bottom when it forms. Our current expectations are for a continued downside price move that will establish a washout-low formation over the next 3 to 10 trading days. We’re not out of the woods yet, but we are starting to see the early signs of price support – which means a bottom may not be too far off.
UNIQUE OPPORTUNITY ONLY IN MAY
On May 1st we talked about the old saying goes, “Sell in May and Go Away!” and that is excactly what is happening now right on queue. In fact, we closed out our SDS position today for a quick 3.9% profit and our other new trade started today is up already 10%.
Second, my birthday is only a few days away and I think its time I open the doors for a once a year opportunity for everyone to get a gift that could have some considerable value in the future.
Right now I am going to give away and shipping out silver rounds to anyone who buys a 1-year, or 2-year subscription to my Wealth Trading Newsletter. I only have 13 left as they are going fast so be sure to upgrade your membership to a longer-term subscription or if you are new, join one of these two plans, and you will receive:
1-Year Subscription Gets One 1oz Silver Round FREE
(Could be worth hundreds of dollars)
2-Year Subscription Gets TWO 1oz Silver Rounds FREE
(Could be worth a lot in the future)
I only have 13 more silver rounds I’m giving away
so upgrade or join now before its too late!
SUBSCRIBE TO MY TRADE ALERTS AND GET YOUR FREE SILVER ROUNDS!
Happy May Everyone!
Chris Vermeulen


