SPY/SPX Island Setups Warn Of A Potential Reversal In This Uptrend
My researchers and I want to highlight a Weekly chart pattern that is warning of a potential Top/Reversal in the SPY & SPX. Although the current trend is Bullish and the markets are looking forward to the new year, new policies, and probably new stimulus which normally prompts some type of upward price rally in the markets, we see an “Island Setup” that has continued to form after all the positive COVID-19 vaccine news.
An Island Setup in price is when price moves or Gaps away from a typical price range or boundaries, then stalls. This type of setup is similar in structure to a Doji Star setup in an “Evening Star” formation. Similarly, the Doji Star pattern also warns of a possible trend reversal. Our researchers believe any continued failure to rally at this stage points to a very real downside price reversal setting up in the SPY/SPX. Let’s take a look at some Weekly charts.
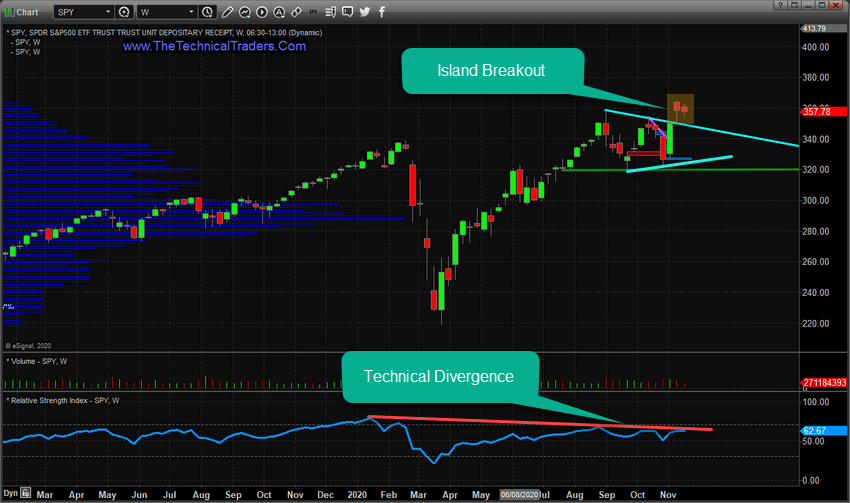
SPY ISLAND SETUP
The SPY Weekly chart below highlights the Island Price formation as well as the technical divergence in the RSI indicator (below the price chart). What interests our researchers is the clear Island price setup outside the CYAN consolidation/FLAG formation. Either the SPY is going to continue to rally much higher at this point or it is going to fail in this Island formation and fall back to the $320 level. The more price fails to rally at this stage, the more likely the downside price expectation becomes.
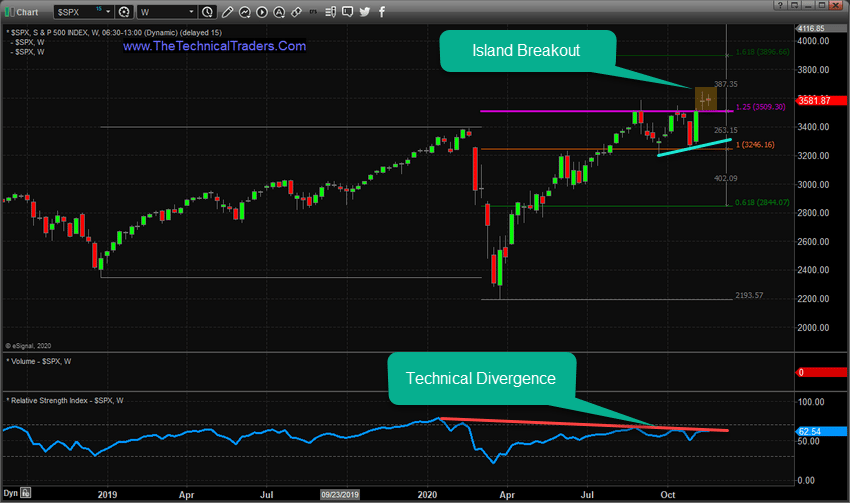
SPX ISLAND SETUP
The following SPX Weekly Chart shows a similar pattern with the same RSI Technical Divergence. Take note of the Double Doji Island setting up recently, and how Double Doji patterns are very indicative of market indecision and potential reversal patterns. The most important single candle in Japanese Candlestick Theory is the Doji Candle.
Be sure to sign up for our free market trend analysis and signals now so you don’t miss our next special report!
We’ve also drawn a Fibonacci Extension range on this chart and want to highlight the 125% Fibonacci Extension (in MAGENTA). This levels appears to be very strong resistance and could become a make or break price level for the SPX in the future.
Overall, these setups continue to warn of a reversal, but as of right now we don’t have any confirmation that the bullish trend has ended. We will warn that any future breakdown in price below this Island price formation would be a very clear indication that the bullish trend has stalled and a new downtrend may be setting up.
There is another type of Japanese Candlestick pattern that this resembles, called a Scouting Party. A Scouting Party pattern is established when price moves above resistance, or below support, in an attempt to secure new price highs or new price lows – but fails to hold these price levels over time. This is also indicative of an attempted price trend that fails and results in a price pullback/correction.
Right now, the market price in the SPY and SPX is “scouting for new support”. Keep your eyes on the MAGENTA Resistance levels as price continues to try to retain these new highs. If you want us to help you find and identify great trading opportunities, then please visit www.TheTechnicalTraders.com to learn about my proprietary trading systems. You can also sign up for my daily pre-market video reports that walks you through the charts of all the major asset classes every morning.
Have a great weekend!
Chris Vermeulen
Chief Market Strategist
www.TheTechnicalTraders.com
NOTICE AND DISCLAIMER: Our free research does not constitute a trade recommendation or solicitation for readers to take any action regarding this research. We are not registered financial advisors and provide our research for educational and informational purposes only. Read our FULL DISCLAIMER here..