Real Estate Showing Signs Of Collateral Damage- Part II
Continuing our multi-part article related to our belief the Real Estate sector is about become the next big segment to begin to collapse as a result of the COVID-19 virus event and the extended shutdowns taking place throughout the globe, we’ll continue to review the data and explore various options for skilled technical traders.
In Part I, we shared some recent data that suggests the housing market is starting to fracture at quite a fast rate. Today, we’ll explore additional data that could help us understand where opportunities exist and how to prepare for this potential second phase of a broader financial collapse.
Over the past few years, the housing market has continued to rally past almost everyone’s expectations. The COVID-19 virus event was simply a catalyst for a revaluation event within a hyper-inflated financial system. For nearly 20 years, global central banks continued to pour capital in the global markets attempting to spark inflation rates that supported rising interest rates. This is like pumping Helium into a failing balloon attempting to keep it inflated and floating. As long as the structure of the balloon does not rupture, it might hold up for a while longer. Once the structure bursts, it’s all over.
With the housing market, the revaluation event that usually takes place is a contraction in price that usually lasts about 3.5 years. Are we setting up another revaluation event in the housing market?
Before you continue, be sure to opt-in to our free-market trend signals
before leaving this page, so you don’t miss our next special report & signal!
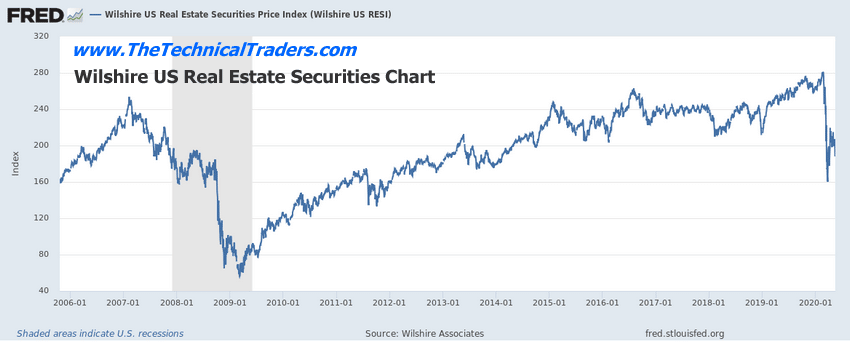
Wilshire US Real Estate Securities Chart
This Wilshire Real Estate Securities Chart highlights the dramatic collapse recently in Real Estate values. Overall, a decline of this magnitude happened near the end of 2008 – at the height of the Credit collapse. Given the scope of the COVID-19 virus event, we believe this initial collapse reflects a bigger impulse move that could extend for many months into the future. A breakdown below the 160 level would suggest confidence in the Real Estate market has completely collapsed.
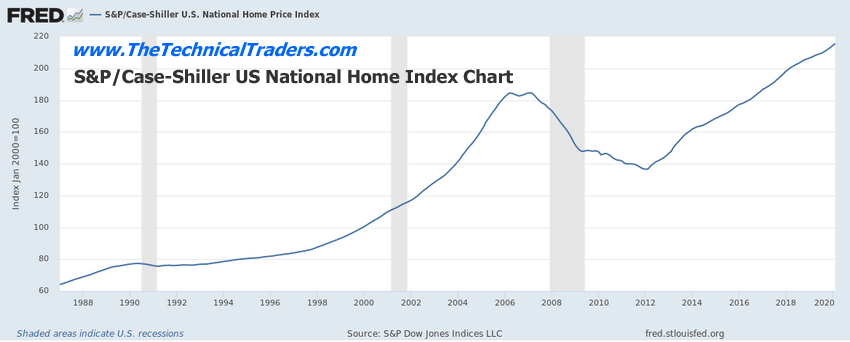
S&P Case-Shiller US National Home Index Chart
The Case-Shiller Index has yet to reflect any real stress on the US Real Estate market – yet we believe this is because current listing price levels have yet to reflect the changes taking place in the underlying market dynamics. Unlike the 2008 credit crisis, where Real Estate was a major factor in the collapse the took place, this time the economic collapse is a result of a pandemic that is expanding out into broader sectors of the economy. Changes in the Case-Shiller Index may not be seen for another 30 to 60+ days.
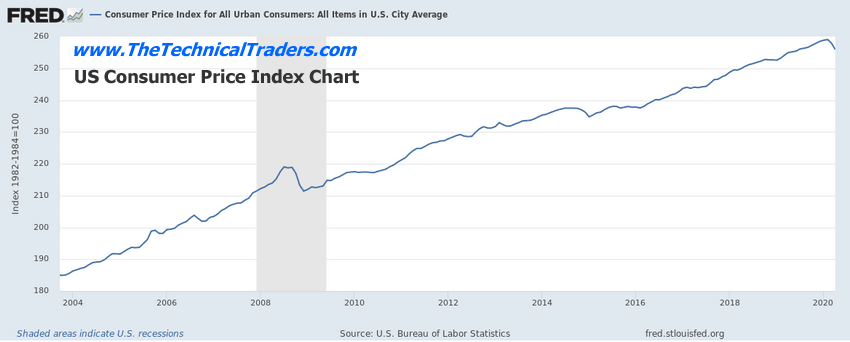
US Consumer Price Index Chart
The CPI chart suggests a broad decline in consumer costs of all items recently. Pay attention to how deeply the CPI level contracts over the next few months. Certain items may inflate while others deflate throughout 2020. We believe this is very likely as we believe a “revaluation” process is taking place throughout many global markets. Real Estate, being one of the most expensive purchases anyone can make, will likely revalue as well.
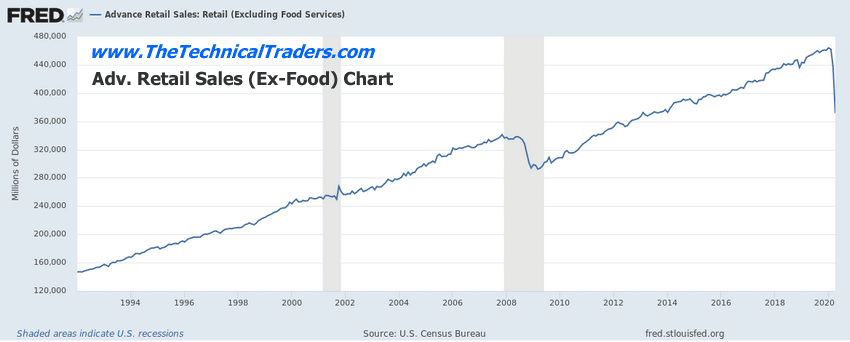
Adv. Retail Sales Index Chart
This Retail Sales chart highlights one of the most dramatic downturns in US history over the past 30+ years. The COVID-19 virus event is collapsing the economy in ways we’ve never experienced before. A collapse in demand (consumer retail and other purchases) also collapses tax revenue, business earnings, global economic spending, and GDP. Our research team believes the global GDP could contract by as much as 25% to 30% over the next 24+ months
Concluding Thoughts:
Right now, we are advising our clients to wait for stronger confirmed trading setups as we believe the current US market is still in a no man’s land related to price levels and future trends. There is still a moderate change the US Fed buying will prompt a bit more upside price trend, but our modeling systems and technical indicators are suggesting a “double-dip” low will form as the collateral damage continues to become known. This is the time for skilled technical traders to play very conservatively with their capital and to target bigger trends when the setup.
The next 24+ months are certain to be full of incredible opportunities for skilled technical traders – yet also full of risks. We’ve already received emails from individuals who have taken aggressive trades in certain sectors and gotten burned. Follow our research and please understand the markets will do what they are going to do. Our job is to find the right opportunities and to capitalize on them for profits.
We suggest reading the following:
One of the most interesting research articles we published in January 2020 was NASDAQ SET TO FALL 1000PTS IN EARLY 2020, AND WHAT IT MEANS FOR GOLD: https://thetechnicaltraders.com/nasdaq-set-to-fall-1000pts-in-early-2020-and-what-it-means-for-gold/
Additionally, we published this article which highlighted the similarities of the current market peak to 1999: https://thetechnicaltraders.com/current-rally-similarities-to-1999-are-we-nearing-a-top/
If you want to improve your accuracy and opportunities for success, then we urge you to visit www.TheTechnicalTraders.com to learn how you can enjoy our research and our members-only trading triggers (see the first chart in this article). If you are managing your retirement account or 401k, then we urge you to visit www.TheTechnicalInvestor.com to learn how to protect your assets and grow your wealth using our proprietary longer-term modeling systems. Our goal is to help you find and create success – not to confuse you.
In closing, we would like to suggest that the next 5+ years are going to be incredible opportunities for skilled traders. Remember, we’ve already mapped out price trends 10+ years into the future that we expect based on our advanced predictive modeling tools. If our analysis is correct, skilled traders will be able to make a small fortune trading these trends and Metals will skyrocket. The only way you’ll know which trades to take or not is to become a member.
Chris Vermeulen
Chief Market Strategist
Founder of Technical Traders Ltd.