Predictive Modeling Suggests Gold Will Break Above $1650 Within 15~30 Days
Our Adaptive Dynamic Learning predictive modeling system is suggesting Gold will rally above $1650 within the next 2 to 4 weeks, then settle into a narrow price range above $1600. If you’ve followed our analysis of Gold over the past few months and years, you already know we expect Gold to rally above $1750 this year and to continue to move higher attempting to breach the $2100 level. It is just a matter of time as far as we are concerned where Metals begin a massive upside rally as the global debt markets become an issue throughout the world.
Right now, there is a very clear opportunity for Gold to rally nearly $100 over the next few weeks. Our ADL predictive modeling system is suggesting this really should begin very soon and will likely propel the price of Gold to levels above $1640 before March 15. Of course, as we’ve seen before if price stays below the $1600 level for another few weeks, this will set up a “price anomaly” where the price will, at some point, attempt to rally very aggressively to the upside to make up the difference.
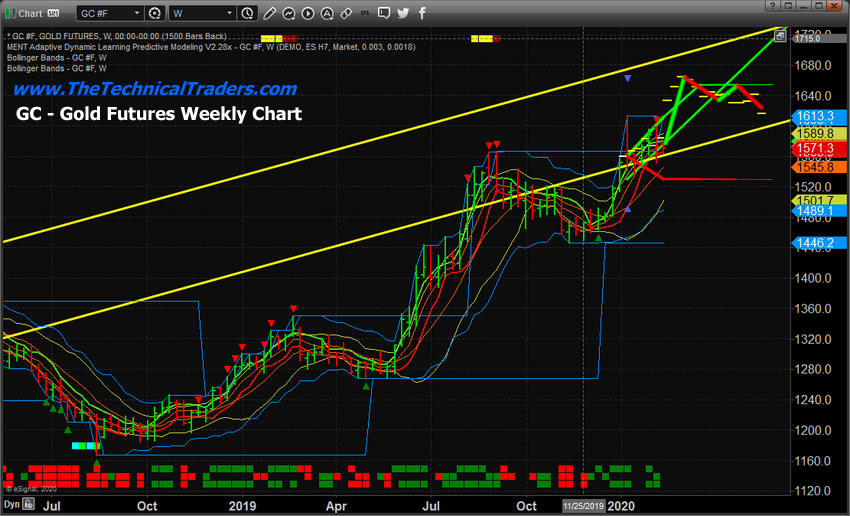
Weekly Gold ADL Chart
This Weekly Gold ADL chart highlights the predicted price movement higher, above $1640, then sideways afterward – setting up a new momentum base. You can see how Gold enters rally phases, then bases for 5 to 10+ weeks. We believe this next move higher will be a continued advancement leg in Gold that may prompt a short momentum base before another rally sets up near April/May 2020.
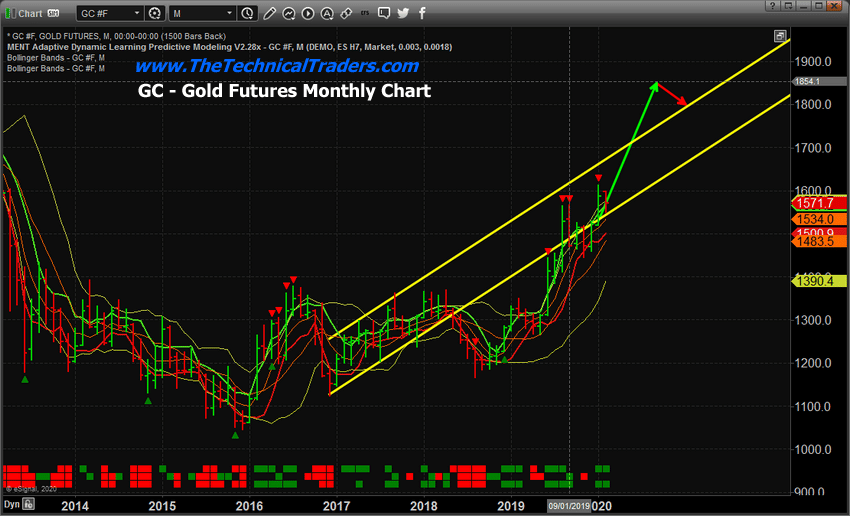
Monthly Gold ADL Chart
This Monthly Gold ADL chart highlights our overall trend expectations for Gold going out 8+ months into the future. We believe this upside price rally is ultimately targeting levels above $1800. It will likely attempt this move in multiple upside price legs containing various pause/momentum basing events. Yet we believe the ultimate upside objective in Gold is really $1800 to $1850 before a new downside leg will setup. That downside leg will end fairly quickly, then the next wave of buying will push the price above $2100 and ultimately much higher.
If you have not yet seen our silver and silver miner charts and predictions see this article.
Concluding Thoughts:
This is an excellent opportunity for skilled traders to attempt to buy Gold or Silver near current levels before the upside breakout pattern drives prices 4% to 6% higher ($75 to $100). Pay attention to our research and be prepared for these bigger sector swings. 2020 is going to be a great year for technical traders.
Learn how we can help you find and execute better trades and turn the extreme volatility into solid profits. Read our research and see what our research team has been predicting over the past few months. We dedicate our efforts to helping you find great trades and helping you protect your assets.
Join my ETF Trade Alert Newsletter if you like what you read here and ride my coattails as I navigate these financial markets and build wealth while others lose nearly everything they own.
Chris Vermeulen
www.TheTechnicalTraders.com
NOTICE: Our free research does not constitute a trade recommendation or solicitation for our readers to take any action regarding this research. It is provided for educational purposes only. Our research team produces these research articles to share information with our followers/readers in an effort to try to keep you well informed. Visit our web site to learn how to take advantage of our members-only research and trading signals.