Precious Metals Give Traders Another Opportunity
We know many of you follow our research posts and have been waiting for the Gold/Silver setup we predicted would happen near April 21~24, 2019 back in January 2019. Well, it looks like our predictions were accurate and the current downward price rotation in Gold/Silver are the opportunities of a lifetime for precious metals traders.
Our original research regarding the predicted Gold price rotation and breakout initially posted in October 2018 and was updated in January 2019. You can read our updated post here.
This research suggested, back in October 2018, that gold would rally above $1300, then stall and setup a momentum base near April 21~24, 2019. Currently, we are actively seeking entry positions in Gold, Silver and many other stock market sectors related to the metals and miners.
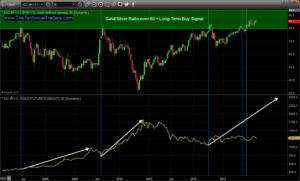
We’ll start by highlighting the Gold to Silver price ratio. When this ration moves well above 80, it is generally considered a long term buy trigger. The reason for this is that this ratio attempt to reflect the price of Silver to the price of Gold. When this level reaches above 80, it traditionally reflects an extremely cheap price ratio for both Gold and Silver and usually prompts a big price advance in the near future.
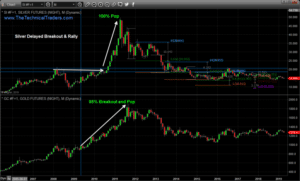
Taking a look at historical price moves for both Gold and Silver, we fall back to the big upward price advance that began after the 2009 market crash. One thing that all traders and investors must understand is that, currently, Silver presents an incredible opportunity for bigger returns than Gold. Yes, Gold will likely rally higher and provide an incredible opportunity for upside gains. Yet, historically, Silver begins to move a bit later than Gold does and the upside potential of Silver tends to be 40~70% greater than the upside potential for Gold.
Take a look at this comparison chart, below, of the 2009 to 2011 price move. Gold shot up nearly 100% – as shown on the chart. Silver shot up over 150% when the breakout move happened a bit after the Gold move started. We expect the same type of price advance pattern in the near future. We expect Gold to begin the move higher and Silver to lag behind this upside move a bit – possibly for a few months. Eventually, Silver will break to new multi-year highs and could rally 130% to 220% above current levels – possibly higher.
Over the next few months, we believe increased volatility in the US stock market may drive prices a bit lower as price rotates near all-time highs. We believe this rotation, coupled with foreign market concerns (think Brexit, Europe, China, South America) as well as the US Election cycle may cause the markets to enter a period of stagnation and sideways trading. These impulses may become a catalyst for precious metals to break recent highs and begin an upward price advance as a general increase in FEAR settles into the global markets.
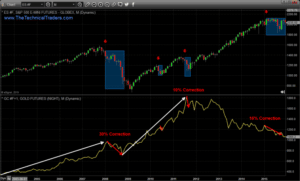
We do believe Gold and Silver will likely move a bit higher over the next 30+ days as the US stock markets continue to push higher towards new all-time highs. Yet, if the volatility increases, as we expect, and a bigger price rotation takes place (see the chart below), we believe Gold and Silver may experience another price drop to near or below current levels before a massive upside breakout move begins. Historically, the price of Gold contracts throughout the initial price correction phase of the S&P500 and begins to accelerate upward near the end of a correction phase. This is because investors and traders are typically shocked to see the correction take place and move into a protective mode as true fear sets in. When fear subsides, traders move out of precious metals and back into stocks.
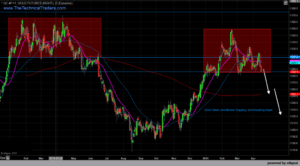
Our current expectations are that Gold will continue to push lower, below $1275, in an attempt to establish our April 21~24 momentum base. This base should be at or near ultimate lows for the price of Gold and we would expect a pennant or sideways price channel to complete this bottoming formation. Ideally, any price move below $1250 is a gift for skilled traders. We’ll just have to wait to see where this bottom sets up before we know just how low Gold will fall before the next leg higher.
We believe the next upside price leg in Gold will push prices above $1400 initially, likely in May or June 2019. After that peak is reached, we believe a period of rotation and a potential for a price decline is very real. We believe this next leg higher will really to levels above $1400, then price will stall and retrace – possibly retracing back to levels below $1300 again. It would be at that point that skilled traders should consider this the last opportunity for long entries before the bigger move to the upside.
Our research into this move, which initiated back in October 2018, has called these rotations almost perfectly. If our newest research is correct, you will have at least two opportunities to enter fantastic long trades in Gold and Silver, one setup hitting between April 21 and April 28 and another setup after the initial upside price rally retraces (likely in June or July 2019). After that last retracement, we believe the bigger upside rally will begin and both Gold and Silver will initiate a rally that could be an opportunity of a lifetime for skilled traders.
Follow our research by visiting www.TheTechnicalTraders.com to learn how we can help you find and execute better trades in 2019 and beyond.
Chris Vermeulen


