Part III – Is the Fed Too Late Prevent A Housing Market Decline?
So, the reality is that based on our modeling system and our research, there are only two ways that the US Fed (and likely the global central banks) can navigate out of this inflation killing debt glut that has sunk the global markets into a quicksand-like economic malaise; either A. reduce debts dramatically across the board (all nations) in an attempt to allow for some level of future growth/inflation opportunity, or B. find a way to push GDP out levels to 2x (or higher) that of current debt levels. A is much more difficult to negotiate and navigate – but it may be an option sometime in the future. B is the more likely option with a transition into some type of new 21st-century economic model that assists in advancing the build-it, sell-it model.
In the last, Part II, a section of our research, we showed you a chart of our US Fed modeling system and where we believe the US Fed should be targeting rates currently. The one thing that was a bit different than our original model, created in 2013, was the election of President Trump and the EU, US/China trade wars. This could complicate things a bit in the future, but overall the model continues to perform well. But before we get into the details, be sure to opt-in to our free market forecasts newsletter.
Our research suggests that given current global market factors, we are looking at a very narrow pricing structure for US fed rates that are completely dependent on consumer activities (consumer optimism and activity, perception of the economic opportunities and supply/demand price equilibrium). Which is why we believe the next 15+ months could be very interesting for global traders and consumers.
We use a simple tool to track the levels and scope of the changing markets in various areas of the US and have noticed a dramatic increase in the numbers of Foreclosures and Pre-Foreclosures in various prime markets over the past 12+ months. Take a look at some of these maps.
Be sure to opt-in to my free market research newsletter
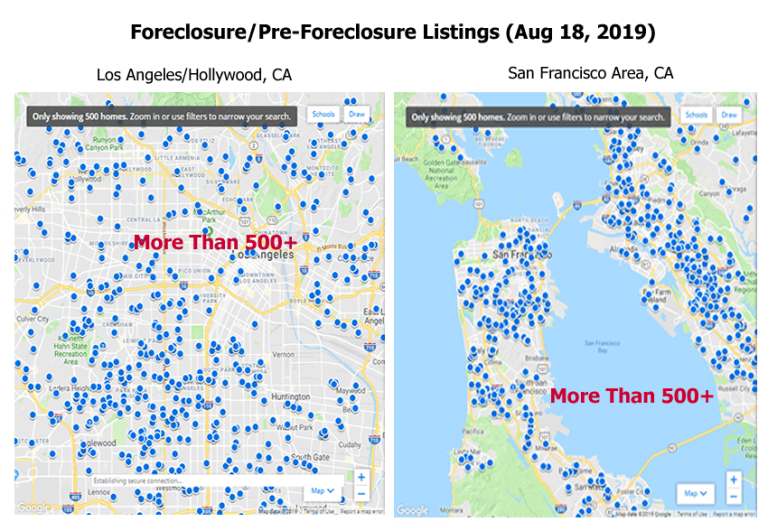
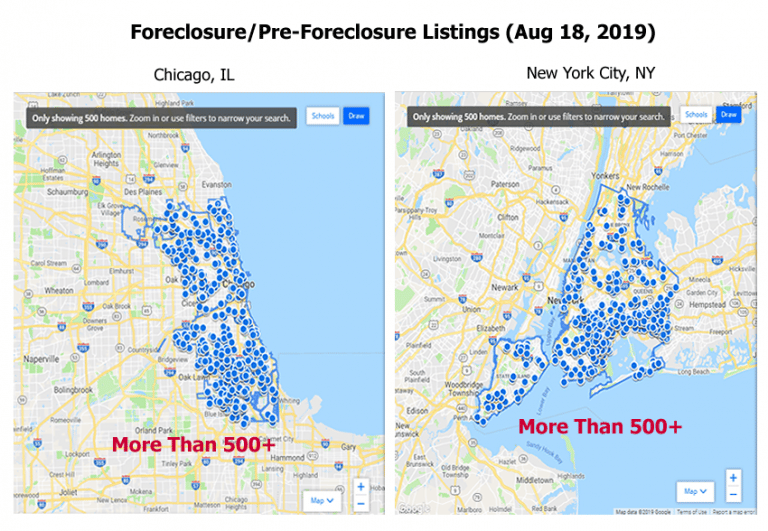
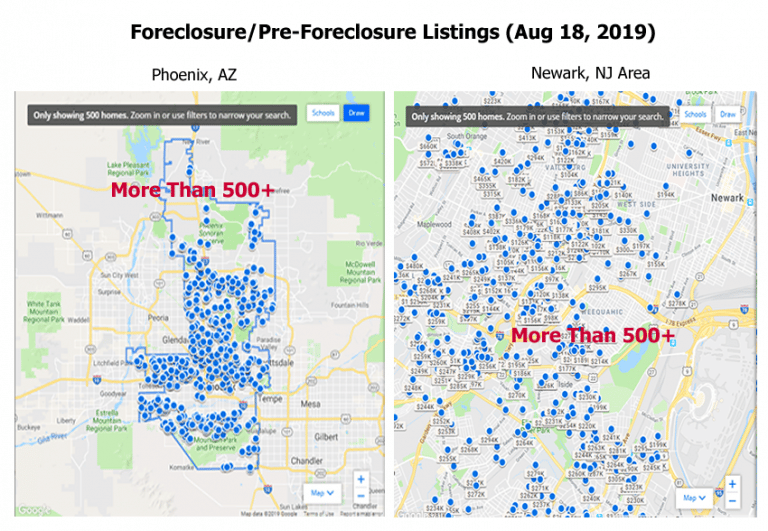
In each one of these maps, there are more than 500+ current active Foreclosures and/or Pre-Foreclosure listing. These are prime real estate areas like Los Angeles/Hollywood, CA, New York City, NY, San Francisco, CA, Phoenix, AZ, Chicago, IL and Newark, NJ. Either the market is changing or the consumer is changing because affordability is sky-high.
The law of supply and demand dictates that when the price gets too high and affordability is beyond the scope of the average buyer, then price MUST fall to levels that support healthy buyers and re-balance the marketplace. This type of price reversion has happened many times in the past, but this time we believe the US Fed may just let the dust settle and allow these foreclosures to funnel through the traditional channels (banks and financial institutions.
We do believe the US Fed is slightly behind the curve in terms of rate levels and actions. The Fed waited till 2016 to begin raising rates when our model suggested rates should have been raised in 2013. Additionally, the Fed raised rates above the 2.25% upper boundary of our modeling system. The Fed recently began to decrease rates from the 2.5% level which we agree with. The Fed target should be between 1.5% to 2.0% at this point and levels should fluctuate up and down within this range for the next 4+ years – gradually settling near 1.25% near 2024.
Again, there are only two outcomes that can dramatically alter the path without our modeling system – dramatic debt reduction or dramatic GDP increases. Possibly, we may see a combination of both of these over the next 10+ years, but our belief is that the US Fed is trapped in a low growth, mild inflationary mode waiting for GDP to increase while attempt to PRAY that no asset bubble pops. The reality is that bubble will pop and price levels will revert to find “true value” before any real GDP increases begin to take form.
CONCLUDING THOUGHTS:
It’s going to be an interesting 10+ years, folks. Get ready for some really big price swings in almost all the global markets and various sectors.
Real Estate has already run through the price advance cycle and the price maturity cycle. There is really only one cycle left to unfold at this point which is the “price revaluation cycle”. This is where the opportunity lies with select real estate ETFs which we are keeping my eye on to profit from falling real estate prices.
I can tell you that huge moves are starting to folding not only in real estate, but metals, stocks, and currencies. Some of these supercycles are going to last years. Brad Matheny goes into great detail with his simple to understand charts and guide about this. His financial market research is one of a kind and a real eye-opener. PDF guide: 2020 Cycles – The Greatest Opportunity Of Your Lifetime
As a technical analysis and trader since 1997, I have been through a few bull/bear market cycles. I believe I have a good pulse on the market and timing key turning points for both short-term swing trading and long-term investment capital. The opportunities are massive/life-changing if handled properly.
I urge you to visit my ETF Wealth Building Trading Newsletter and if you like what I offer, join me with the 1 or 2-year subscription to lock in the lowest rate possible, get a FREE BAR OF GOLD and ride my coattails as I navigate these financial market and build wealth while others lose nearly everything they own during the next set of crisis’.
Chris Vermeulen
www.TheTechnicalTraders.com