Financial Crisis Bear Market Is Scary Close
Everyone knows something bad is brewing not just in the USA but globally within the financial systems. Most countries are bankrupt, and almost all currencies have been losing value for the past year. Everyone is playing the game of musical chairs and getting creative with how they borrow, lend, create, and steal money in hopes the world does not catch on to just how corrupt and bad things really are. Read Part II
It’s just a matter of time before we see another financial market meltdown and what I show you here today gives you an idea of just how close we could be to a market collapse. But before we get into the details, be sure to opt-in to our free market forecasts newsletter.
The financial markets rarely repeat the same type of crisis, but most crisis’ cause the stock market to sell off and crash in the same way. Human nature and emotions do not change, and because traders and investors drive the price action of stocks we are able to profit from bear markets.
In fact, bear markets can be life-changing in a good way for those who know how to trade these market conditions. Because stocks fall 3-7 times faster than they rise, you can generate the same amount of returns someone who invested at the beginning of a 10-year bull market and sold at the top, but you can do this in 8-12 months because of how quickly prices fall.
Three Leading Sectors To Watch
Transports, Industrials, Small-Cap Stocks
The transportation sector refers to the transportation of goods or customers using major and regional airlines, railroads, shipping firms, ocean freight haulers, trucking, etc… It is these companies that see a slow down in the economy before almost everyone else as less shipping is required when sales slow or the economy is tightening using less food, fuel, or buying things in general.
The second sector is industrials. This works much like the transportation sector.
Last but not least is the Russell 2ooo small-cap stock index. These small and volatile stocks are the first to show signs that traders and investors are tightening their risk-reward ratios because they feel the stock market is overpriced and that a bear market could be near, and the last type of stock you want to own during a bear market are small-cap stocks.
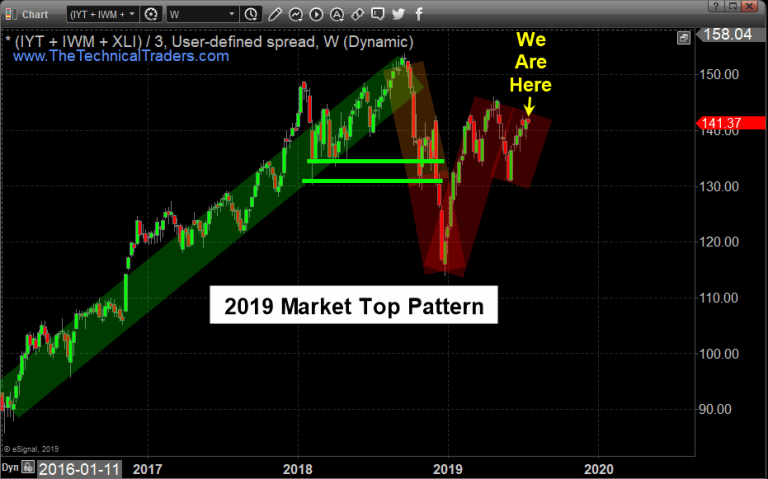
2016 – 2019 Custom Chart of Three Sectors
Trans (IYT) + Industrials (XLI) + Russell (IWM) / 3
The chart below shows the recent and current day price action of these three leading sectors. Notice the long multi-year rally into the high of 2018 followed by the sharp distribution selling that warns the big money players unloaded their positions in these leading and leveraged sectors.
The 2019 rally has been strong but when you look at the big picture, the price is far from its 2018 highs and the price pattern is bearish (it points to lower prices) from a technical analysis standpoint.

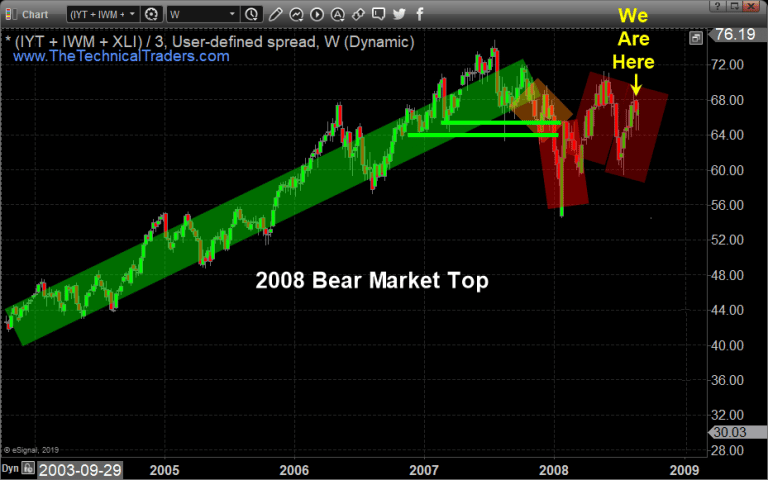
2004 – 2008 Custom Chart of Three Sectors
The last bull market looks nearly identical in terms of the run-up in price, the top in 2007, and the distribution sell-off in these sectors. The 2008 rally was strong as well, but far from the 2007 highs as well.
What I want you to notice is the fact that these charts have moved nearly the same. Just like I mentioned earlier how bear markets price patterns repeat, so do bull market price patterns. The 2009 price action and 2019 price action are nearly identical and when you see the next chart you will see why the financial market is scary close to the next crisis/bear market.

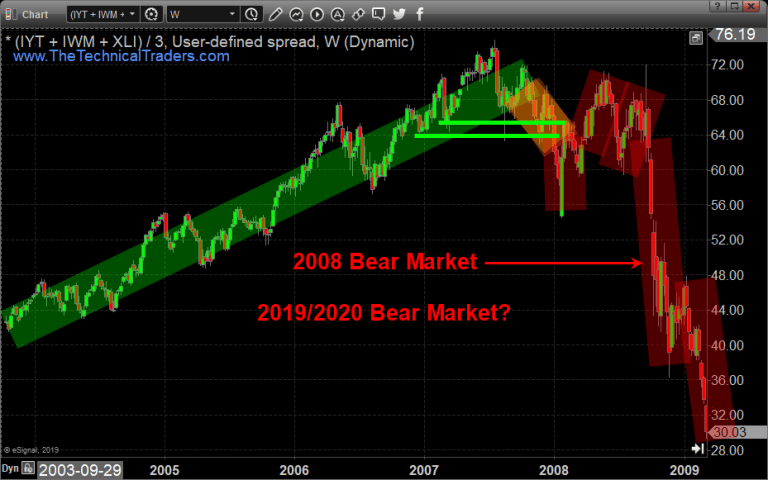
2009 Market Crash Custom Chart
Trans (IYT) + Industrials (XLI) + Russell (IWM) / 3
Bases on the 2008 weekly chart below the US stock market could be literally 2-6 weeks away from collapsing. What makes this even scarier is that the market liquidity is the worst its been in my 23 years of trading meaning when the selling starts we will likely see some sort of flash crash as we saw in 2008, 2015, and 2018. Price drops so quickly by the time you figure out what you want to do and get your money properly positioned most of the move is already completed.

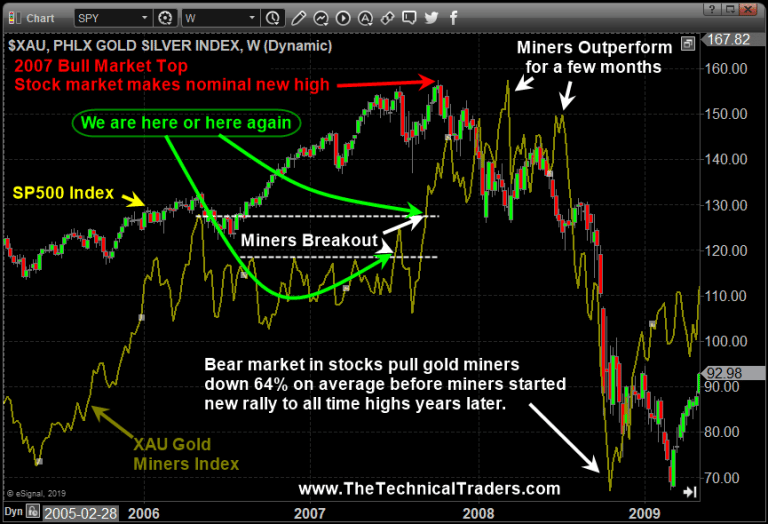
Eye Opening Gold Miners Charts and Analysis from 2008-09
There are several other really intriguing things happening that further confirm this analysis like how gold miners are outperforming US stocks, the gold : silver ratio above 85, the presidential cycle, the decade cycle and many more. It was actually all these other things that made me review these leading sectors here today. I’ll touch on these other topics in the next few articles later this week
The chart below shows you what the stock market and gold miners did just before the bull market topped and what they did after. Be aware, if you’re a gold bug you may not like this chart but you can’t argue with the truth of what miners did during the bear market and other bear markets for that matter.
See my updated chart showing where gold miners and the stock market is as of today within this cycle: https://thetechnicaltraders.com/next-bull-and-bear-markets-are-now-set-up/

Concluding Thoughts:
In short, the bear market has been a long time coming, but finally, almost all the signs are showing that it’s about to start. As a technical analyst since 1997 having lost a fortune and making a fortune from bull and bear markets I have a good understanding of how to best attack the market during its various stages. Read Part II
Be prepared for these incredible price swings before they happen and learn how you can identify and trade these fantastic trading opportunities in 2019, 2020, and beyond with our Wealth Building & Global Financial Reset Newsletter. You won’t want to miss this big move, folks. As you can see from our research, everything has been setting up for this move for many months – most traders/investors have simply not been looking for it.
Join me with a 1 or 2-year subscription to lock in the lowest rate possible and ride my coattails as I navigate these financial market and build wealth while others lose nearly everything they own during the next financial crisis. Join Now and Get a 1oz Silver Round or Gold Bar Shipped To You Free.
I can tell you that huge moves are about to start unfolding not only in currencies, metals, or stocks but globally and some of these supercycles are going to last years. A gentleman by the name of Brad Matheny goes into great detail with his simple to understand charts and guide about this. His financial market research is one of a kind and a real eye-opener. 2020 Cycles – The Greatest Opportunity Of Your Lifetime
As a technical analysis and trader since 1997, I have been through a few bull/bear market cycles. I believe I have a good pulse on the market and timing key turning points for both short-term swing trading and long-term investment capital. The opportunities are massive/life-changing if handled properly.
I’M GIVING AWAY – FREE GOLD & SILVER WITH MEMBERSHIPS

So kill two birds with one stone and subscribe for two years to get your
FREE PRECIOUS METAL and get enough trades to profit through the
next metals bull market and financial crisis!
Chris Vermeulen – www.TheTechnicalTraders.com

