The Real Estate Bubble: From A Technical Analysis Point Of View
Understanding The Market Cycles
My focus usually lies with stock indexes, sectors, and commodities, but today, we venture into the real estate market. Real estate is a market that many people don’t fully comprehend. Many are excited by the robust housing market, believing it’s never been a better time to buy. But the reality is, I believe we’re in a phase that isn’t ideal for such investments.
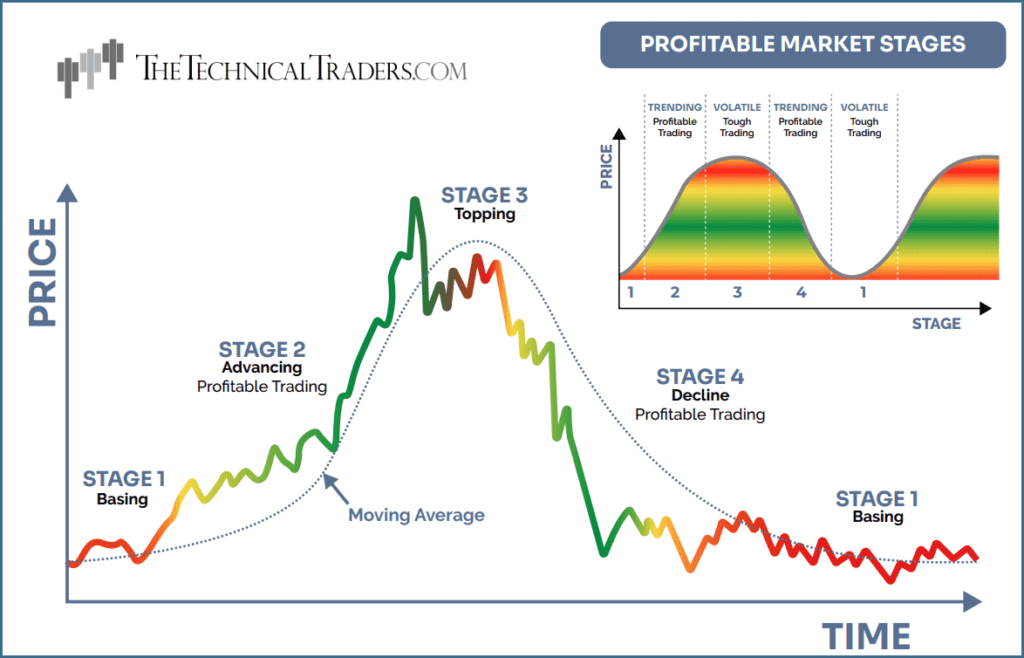
Taking a leaf from Stan Weinstein’s book, he proposed that the market has four stages: Stage 1, where active investment capital isn’t advisable due to the choppy, flatlining market; Stage 2, the bull market phase; Stage 3, a volatile phase where struggle reigns; and Stage 4, a phase marked by a massive decline. Stages 2 & 4 are usually an easy time for investors to make money. But in Stages 1 & 3, it becomes harder to grow your capital and much easier to lose a hefty portion. This is the crucial time to preserve and protect your wealth for reinvestment when conditions improve.
This analysis works for both real estate, as explained here, and also for stock market investors, which I cover in this video.
Multifamily Starts: A Red Flag
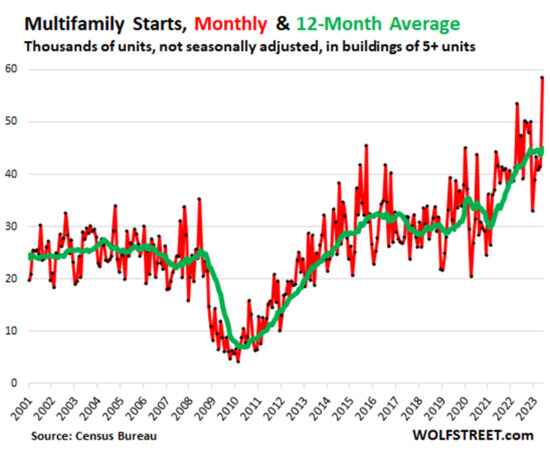
Looking at this chart from Wolfstreet.com, multifamily starts (buildings with five units or more) are at the highest levels since 1986. This surge might look impressive, but historically, these sharp upticks are often followed by multi-year pullbacks in price. This pattern was evident in 2008 when, after reaching new highs, the stock market began to sell off significantly.
Why are multifamily starts skyrocketing now? Because savvy investors are trying to squeeze more money from an overpriced real estate market. Multifamily housing is cheaper to build, with rental units being more affordable for those with financial constraints.
The last time we saw a similar spike was in 2015, followed by several years of slowed housing starts as the market softened.
Single Family Starts: The Early Warning Sign
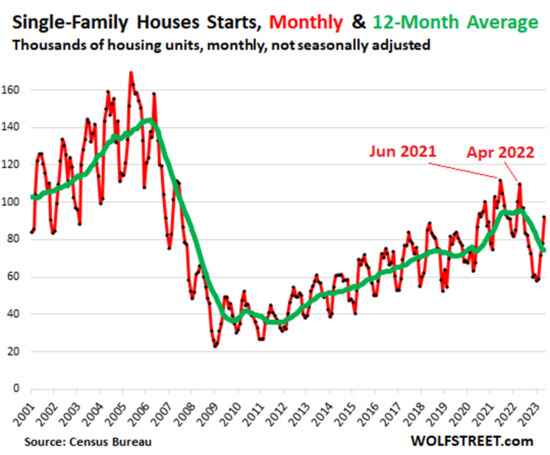
Now let’s turn to single-family starts. Despite the bullish predictions in the market, technical traders can clearly see the trend. There has been a series of lower highs and lower lows since June 2021. This pattern was seen previously in 2006 before housing peaked and began to weaken.
The current trend for real estate is downward, but the recent rally has masked this, bringing it back to the levels seen in 2020.
Total Starts: A Glimpse Into the Future
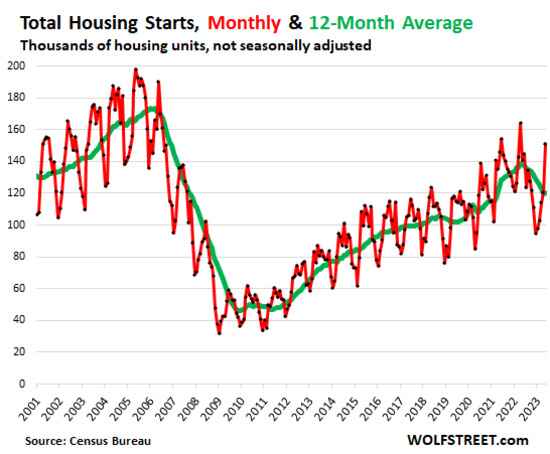
Taking into account both multifamily and single-family starts, we see a similar series of lower highs and lower lows. This trend signals an overall weakening in the real estate market. The current spike is probably the last push, with potential struggles ahead for contractors once this wave of homes has been built.
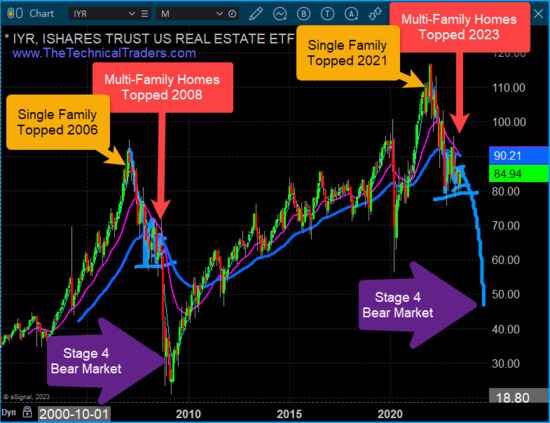
The Real Estate ETF (IYR)
Shifting our focus to the real estate ETF IYR, we notice a clear series of lower highs and lower lows. Savvy investors who invest in these REITs understand that the real estate market is exhausted and struggling.
Looking at the chart, we can see a similar pattern from 2008. The market experienced a major sell-off, followed by a tight channel, before plunging dramatically.
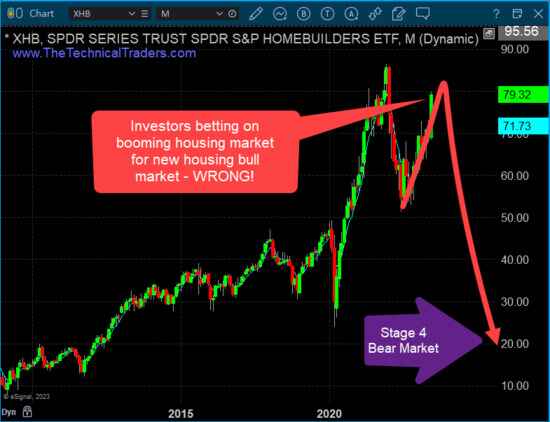
Home Builders: A False Hope?
On the other hand, the Home Builders chart seems to tell a different story. Investors and speculators are piling into the housing building space, creating a FOMO (Fear Of Missing Out) atmosphere. This surge may feel promising, but it’s important to remember that this is likely the peak before a significant drop.
The Future of Real Estate:
So that’s what I see unfolding with the real estate market. I think things will continue to get tough, and over the next year or two, we will be looking at a very different market, a very different world. To me, it’s best to be prepared for that and be smart with your investing. It means being able to protect your wealth, grow your capital safely and thus be able to take advantage of opportunities when they arise.
Technical Trading
I want to touch on the importance of understanding technical trading and chart analysis. Many people dismiss technical trading, thinking it’s just looking at squiggly lines on a chart. But in reality, it’s about understanding supply and demand dynamics, market psychology, and economic cycles. By taking a look at the charts of these real estate ETFs, REITs, and homebuilder stocks, you can see very clear trends and patterns that tell us a lot about what’s going on in the market. This knowledge, in turn, allows you to make more informed investing decisions.
So if you’re not already familiar with technical trading, I highly recommend taking some time to learn more about it. It’s not a perfect science, but it can give you a very helpful edge in the market.
I should also note that 81% of personality types do not favor investors. Meaning your brain likely does not function and process data and emotions in a way that allows you to make money easily like those with a favorable personality. I cover that in detail in another article post.
In Conclusion
In conclusion, I believe we’re on the brink of a significant downturn in the real estate market. I also believe that savvy investors who understand the cycles of the market and who are able to preserve their capital will be in a great position to take advantage of the opportunities that arise during the downturn. Remember, investing is not about timing the market perfectly; it’s about being prepared and making intelligent decisions based on the information you have at hand.
That’s all I have for today, folks. Remember, be smart, stay informed, and always be prepared for whatever the market throws at you. Keep an eye on the charts, keep an eye on the news, and never stop learning. The more you know, the better prepared you’ll be for whatever comes next.
This is Chris Vermeulen from TheTechnicalTraders.com, signing off. Stay safe and happy investing!
Get my free investing newsletter for stocks, real estate, and a better lifestyle
Chris Vermeulen
Chief Investment Officer
www.TheTechnicalTraders.com
Disclaimer: This and any information contained herein should not be considered investment advice. Technical Traders Ltd. and its staff are not registered investment advisors. Under no circumstances should any content from websites, articles, videos, seminars, books or emails from Technical Traders Ltd. or its affiliates be used or interpreted as a recommendation to buy or sell any security or commodity contract. Our advice is not tailored to the needs of any subscriber so talk with your investment advisor before making trading decisions. Invest at your own risk. I may or may not have positions in any security mentioned at any time and maybe buy sell or hold said security at any time.