Math Behind the Crash and What’s Next – PART 2
Yesterday we shared with you Part I – big picture analysis “math” Behind the recent sell-off. Today, we want to show you the what the math is pointing to in the short term and what to expect next.
For this type of analysis, we are going to use the Adaptive Dynamic Learning (ADL) modeling system that attempts to tear apart price and technical data from within a chart and reconstruct future price data by learning from the past. In these examples, we will focus on Weekly and Monthly data going forward about 25 periods. The intent is to clearly illustrate how our earlier analysis (completed near the end of December 2017) is still aligning with our current analysis. Amazing how these things all plug together like a big puzzle when you think about it.
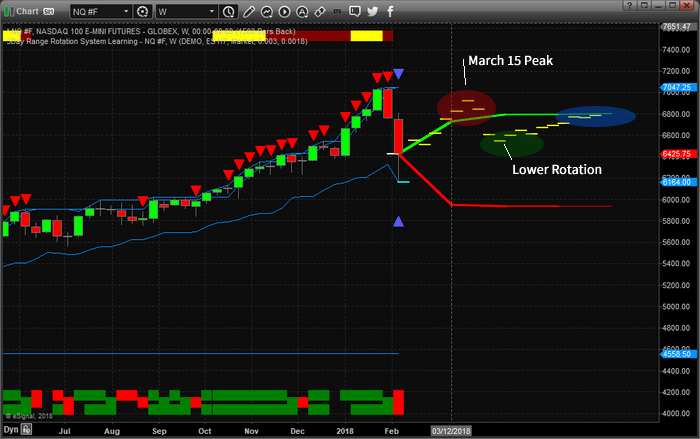
Remember, in late December 2017, we predicted a massive rally to start 2018 that would peak near the end of January or early February with a downside price rotation before stalling near the February 20. At that time, we predicted that a new rally would start and would likely peak near or after March 15.
Take a look at this Weekly NQ ADL chart and tell me what you think of our analysis and predictive modeling systems after understanding how accurate this type of work can be. Yes, nearly two months ago, we predicted this move and our current analysis (as of February 9, 2018) is providing this current prediction.
Based on Weekly data
_ The NQ price should stall and rotate about 100~200 pts higher over the next 2~3 weeks
_ Near March 1, the NQ price should begin another rally that will likely peak near March 15 (+400 pts)
_ After that March 15 peak, the price should fall to near 6600 (-400 pts) before finding support and stalling.
_ Moderate upside price activity will likely follow with more narrow price volatility.
So, are you starting to get a picture of what to expect in the future? Of course, any outside news event (war, catastrophe or other global conflict) could dramatically alter the outcome of price action in the future and our system can’t predict for these types of events. But given historical price action and technical data, this is the most likely outcome (based on 54 unique instances of related data over 10 years of history showing the likelihood of this data being almost 97% accurate).
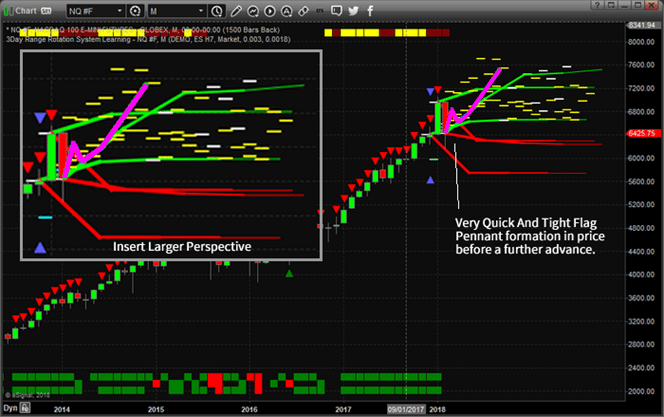
At this point, we are going to reiterate our earlier call of a very QUICK and TIGHT “Flag” or “Pennant” formation in prices over the next few weeks that will result in support likely being found near $6500~6600 in the NQ before another attempt at higher prices is launched. Remember, we are predicting a future where a new rally may start near or after February 20 and a peak in prices should be reach near or after March 15.
This image of the Monthly ADL system is showing, very clearly, that prices will likely rotate within the current price range while establishing a technical pattern for further advancement. We believe our analysis from late December 2017 is still very valid and accurate. We believe this new FLAG formation is a result of the price correction we expected from our earlier analysis, yet we could not predict the severity of the move at that time. We did know that NQ prices had already exceeded our predicted boundaries and because of that we felt that prices were going to contract in a moderately aggressive manner – we even warned our members of this potential.
As of right now, we expect the markets to open next week with moderate price volatility in a pattern that will result in a very quick and tight market FLAG formation. By the time February 20 hits, we believe the US Majors will begin advancing higher towards a March 15th peak.
We’ve included an “Insert Larger Perspective” which is a zoomed in capture of our ADL analysis to help you understand what we are seeing in the markets.
Remember, opportunities exist every week for traders and investors to take advantage of market rotation and key market moves. This is much like our gold miners sell-off prediction report showing the big opportunity using DUST etf.
A Little Taste Of What We Give Traders Like You
Every Morning BEFORE the Opening Bell
If you want to learn more of what we offer our members and how we can assist you in staying ahead of the markets visit: www.TheTechnicalTraders.com. You can also read all of our public research documents on our site as well as talk to a live representative if you like. We look forward to helping you find success in the future.
Get ready for some price recovery and be prepared for a moderate upside move before March 15.
Between my research team and I, we have 53 years experience in researching and trading makes analyzing the complex and ever-changing financial markets a natural process. We have a simple and highly effective way to provide our customers with the most convenient, accurate, and timely market forecasts available today. Our stock and ETF trading alerts are readily available through our exclusive membership service via email and SMS text. Our newsletter, Technical Trading Mastery book, and 3 Hour Trading Video Course are designed for both traders and investors. Also, some of our strategies have been fully automated for the ultimate trading experience.


