Lessons Learned From A Trading Profit Made Shorting Stocks
Jesse Lauriston Livermore (July 26, 1877 – November 28, 1940) was an American stock trader who made a $100 million trading profit by shorting stocks in the great crash of 1929. He is considered a pioneer of day trading and was the basis for the main character of the best-selling trader’s book by Edwin Lefevre called Reminiscences of a Stock Operator (www.Amazon.com).
Jesse Livermore stated: “When trading stocks I always look for favored groups to get weaker and collapse.” “This usually meant a correction was coming in the overall market.”
This is how Livermore called the market turn in 1907, and 1929, as the market leaders rolled over first.
Here are some additional Livermore quotes that are relevant to our current market environment:
- Stocks are manipulated to their highest prices possible and then sold (distributed) to the public on the way down by selling the stock into the rallies.”
- “The big money was not in the individual fluctuations but in the main movements—that is, not in reading the tape but in sizing up the entire market and its trend.”
- “The speculator who insists on trying to profit from daily minor movements will never be in a position to take advantage of the next important change market-wise when it occurs.”
- “After establishing my position all I had to do thereafter was just sit tight and let the market run its course.”
- “Cash was, is, and always will be king.” “Always have cash in reserve.” “Often money that is just sitting can later be moved into the right situation at the right time and make a vast fortune.”
- “There are times when a trader must be out of the market and waiting on the sidelines.”
Livermore also correctly stated that “What has happened in the past will happen again, and again, and again. This is because human nature does not change, and it is human emotion, solidly built into human nature, that always gets in the way of human intelligence.”
We don’t have to look too far to find favored stocks whose prices have completely collapsed. But to keep things reasonable let’s just look at Apple, a stock that was highly favored that has recently been experiencing weakness.
APPLE DROPPED -27.36%
Apple (NASDAQ: AAPL), is a popular American multinational technology company that specializes in consumer electronics, software, and online services. Interesting side note: Apple now has cash and marketable securities that exceed $200 billion.
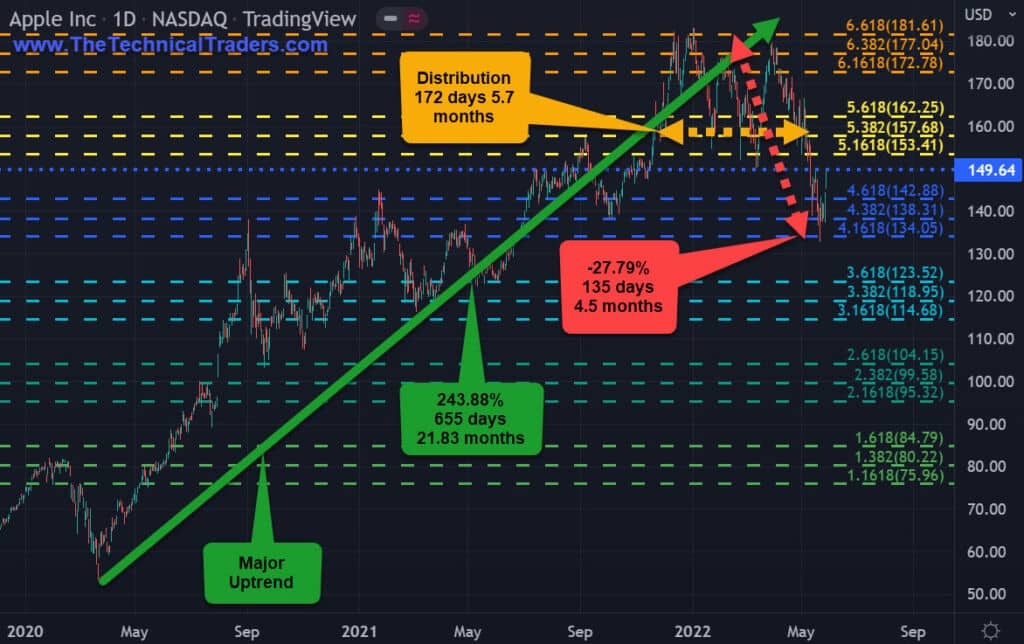
Apple was one of the most favored stocks in 2020-2021. It rallied from a March 2020 $53 low all the way up to its January 2022 $183 high. It then experienced a three-month sell-off where it gave up about –18.04%. However, it immediately followed that downswing with an impressive $30 rally of +20%. But that rally turned out to be nothing more than distribution at the top as the stock then plummeted by $50 per share -26.42% as it breached $132.
APPLE INC • AAPL • NASDAQ • DAILY
THE ANATOMY OF A TRADE USING PRICE – APPLE STOCK EXAMPLE
When using price to trade, it is a good idea to measure the price swings and record their movements: $ amount, a percentage amount, number of bars, and number of days. We then utilize this information to let the market tell us what to do and when we should do it.
The following examples will act as a price guide to walk us through the process of measuring, using, and benefiting from the knowledge we glean from looking closer at the price swing action:
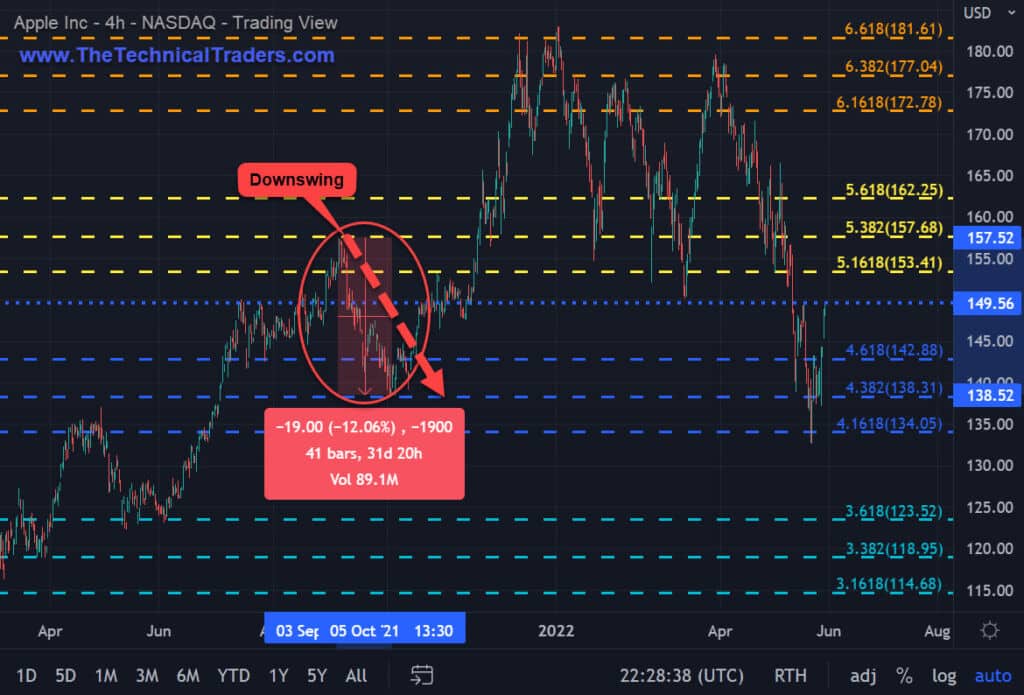
APPLE INC • AAPL • NASDAQ • 4-HOUR • DOWNSWING
This downswing was from September-October 2021: it measured -$19.00, -12.06%, 38-bars, and 27-days.
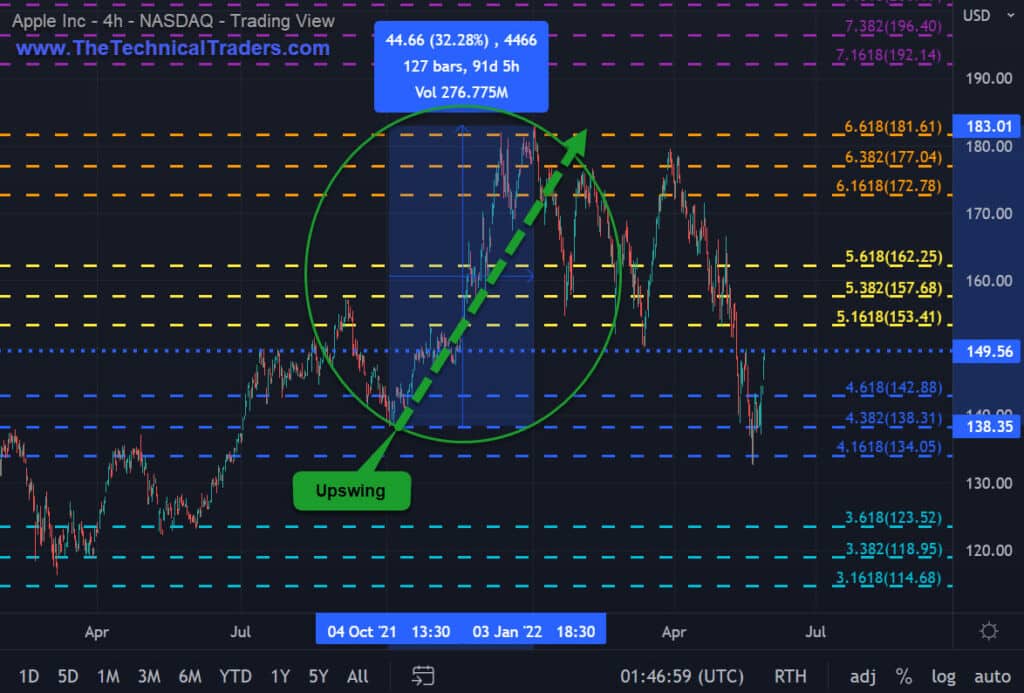
APPLE INC • AAPL • NASDAQ • 4-HOUR • UPSWING
This upswing was from October 2021 – to January 2022: it measured +$44.66, +32.28%, 127 bars, and 91-days. It was more than two times greater in price and three-times greater in time than the previous downswing.
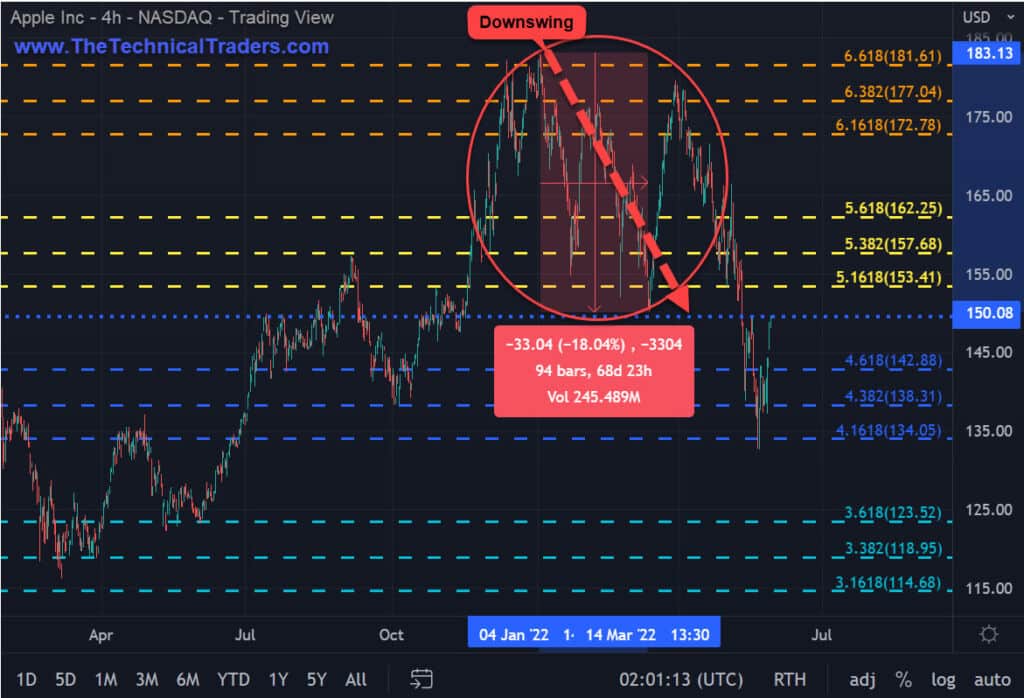
APPLE INC • AAPL • NASDAQ • 4-HOUR • DOWNSWING
This downswing was from January 2022 – to March 2022: it measured -$33.04, -18.04%, 94 bars, and 68 days. Its percentage of -18.04% exceeded the previous downswing of -12.06%. This increase in percentage is a big red flag as the price is telling us that the trend is changing.
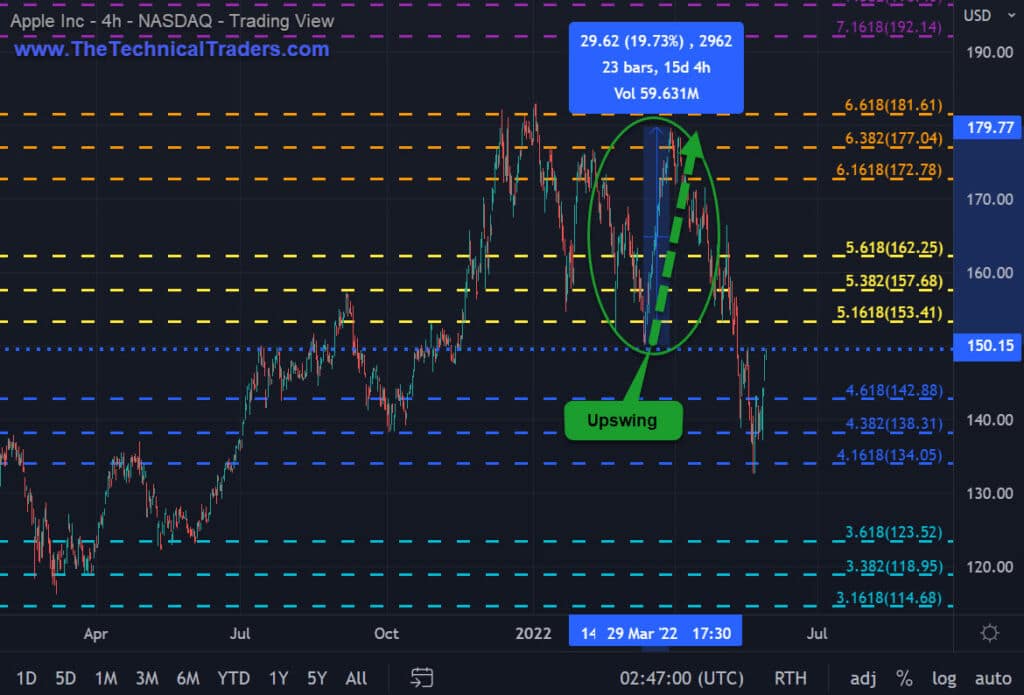
APPLE INC • AAPL • NASDAQ • 4-HOUR • UPSWING
This upswing was from March 14, 2022 – to March 29, 2022: it measured +$29.62, +19.73%, 23 bars, and 15 days. This upswing gave us the perfect opportunity to liquidate our long position or at the very least downsize our position.
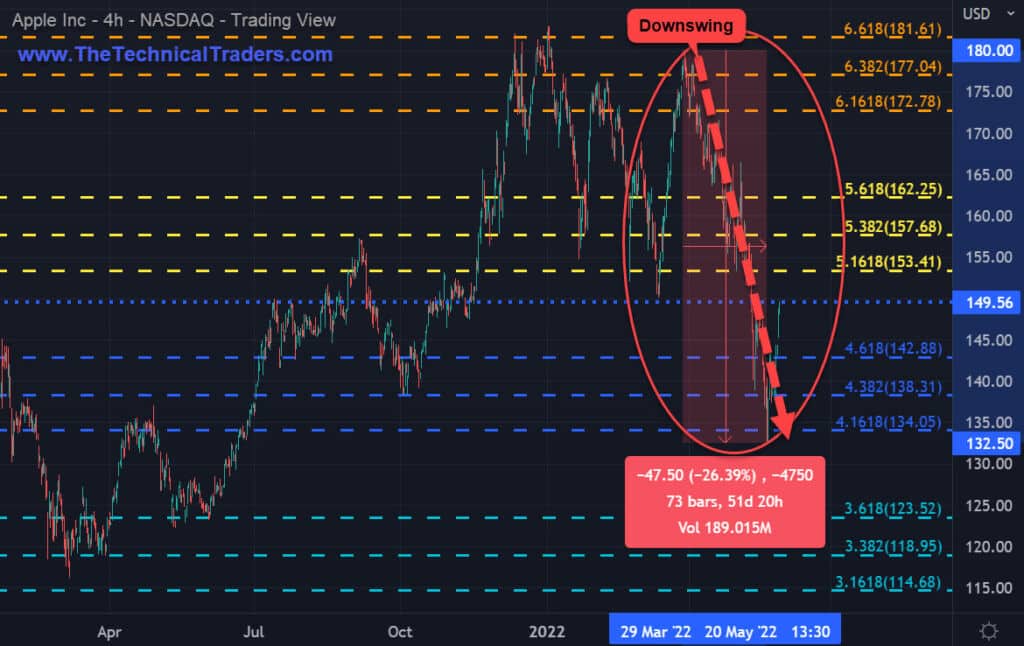
APPLE INC • AAPL • NASDAQ • 4-HOUR • DOWNSWING
This downswing was from March 2022 – to May 2022: it measured -$47.50, -26.39%, 73 bars, and 51 days. Its percentage of -26.39% exceeds both previous downswings of -18.04% and -12.06%. This increase in percentage confirms that we are now in a downtrend.
As the market is currently working on an upswing, we should keep in mind that the previous upswing was +$29.62 or +19.73%. Apple is giving us another opportunity to liquidate any remaining holdings anywhere from our current price level to over $160.
The Sign That The Trend For Apple Has Changed
It should also be noted that the 2020 Covid downswing from January 29, 2020 – to March 23, 2020, was -$29.50, -35.85%, 74 bars, and 53 days.
The current 2022 downswing from the $183 peak to the $132.50 low is -$50.68, -27.67%, 193 bars, and 139 days.
The 2022 downswing exceeds the 2020 Covid downswing in both price and time: -$50.68 vs -$29.50, and 139 days vs 53 days. This is a major red flag signal that the trend in Apple has changed.
Let us remember Jesse Livermore stated: “When trading stocks I always look for favored groups to get weaker and collapse.” “This usually meant a correction was coming in the overall market.”
This is how Livermore called the market turn in 1907, and 1929, as the market leaders rolled over first.
LEARN more about price action FROM OUR TEAM OF SEASONED Traders
In today’s market environment, it’s imperative to assess your trading plan, portfolio holdings, and cash reserves. Experienced traders know what their downside risk is and adapt as necessary. Successful traders manage risk by utilizing stop-loss orders, rebalancing existing positions, reducing portfolio holdings, liquidating investments, and moving into cash.
Managing risk and expectations for both investments in real estate and the stock market is the key for long-term success. Do this, and you can avoid the rollercoaster ride of doing nothing to protect your investments.
Successfully managing our drawdowns ensures our trading success. The larger the loss, the more difficult it will be to make up. Consider the following:
- A loss of 10% requires an 11% gain to recover
- A 50% loss requires a 100% gain to recover
- A 60% loss requires an even more daunting 150% gain to simply return to break even.
Recovery time also varies significantly depending upon the magnitude of the drawdown. A 10% drawdown can typically be recovered in weeks or months, while a 50% drawdown may take years to recover.
Depending on a trader’s age, they may not have the time to wait on the recovery or the patience. Therefore, successful traders know it’s critical to keep their drawdowns within reason. Most of them learned this principle the hard way.
HOW WE CAN HELP YOU LEARN TO INVEST CONSERVATIVELY
At TheTechnicalTraders.com, my team and I can do these things:
- Reduce your FOMO and manage your emotions.
- Have proven trading strategies for bull and bear markets.
- Provide quality trades for investing conservatively.
- Tell you when to take profits and exit trades.
- Save you time with our research.
- Provide above-average returns/growth over the long run.
- Have consistent growth with low volatility/risks.
- Make trading and investing safer, more profitable, and educational.
Sign up for my free trading newsletter so you don’t miss the next opportunity!
We invite you to join our group of active traders who invest conservatively together. They learn and profit from our three ETF Technical Trading Strategies which include a real estate ETF. We can help you protect and grow your wealth in any type of market condition. Click the following link to learn more: www.TheTechnicalTraders.com
Chris Vermeulen
Chief Market Strategist
Founder of TheTechnicalTraders.com