Intra-day Fibonacci Modeling Shows Volatility Is About To Spike
Our research team, at Technical Traders Ltd. alerted us to a Fibonacci technical pattern that is setting up in the US stock market right now. This pattern suggests that volatility will increase dramatically over the next few days/weeks as intra-day price action suggests deeper sideways price action may continue.
One of the key benefits of our proprietary Fibonacci price modeling system is that it automatically learns and adjusts to price action on different intervals. So, by watching the results of this adaptive learning model on various intervals shows different types of setups and expectations, we can develop a consensus among the result to assist us in determining a likely outcome. These models are showing that volatility will increase by expanding out the Fibonacci Trigger Levels for Bullish and Bearish price action. As price begins to consolidate, the proprietary Fibonacci price modeling system adjusts internal computational measures to determine where and when the opportunity exists for trends to form. When these Fibonacci Trigger levels move away from price, it typically suggests bigger moves are about to happen and that volatility will increase.
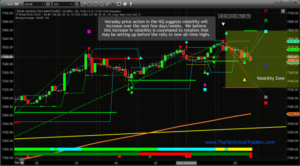
This 120 minute NQ chart highlights the expanded range of the Fibonacci Trigger Levels (called the Volatility Zone). This is the clearest example of what we expect to become a normal price rotation zone for the NQ. Right now, our expectations are that a range from 7500 to 7660 is expected. This means we could see deeper price rotation closer to the 7500 level and up to near the 7660 level without any real trend being established. Eventually, as price rotates and consolidates, these Fibonacci Trigger levels will adjust to better identify future trends. Currently, they are warning of increased volatility and the likelihood of bigger price rotation ahead.
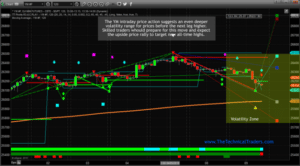
This 120-minute YM chart highlights the range of the volatility zone based on Fibonacci Projected Target levels. Although the YM chart does not include the wider Fibonacci Trigger levels, we believe this increased volatility suggested by the NQ chart will carry over into the YM and ES charts as well. Therefore, we believe the entire US stock market will enter a period of increased volatility over the next 5~15 days.
We have highlighted a price range from 25,750 to 26,500 as an expected rotational range. It is highly likely that the 25,980 level will act as support, thus we believe any price move below this level will present a key buying opportunity for the final leg higher. Overall, the extended volatility we expect should be a moderate price rotation before the final rally to new all-time price highs for the US stock market. This rotation will present key buying opportunities for skilled traders wanting to catch that last 4~12% upside swing in the US stock market.
It is highly likely that the YM falls to near the 25,980 level (near the ORANGE Moving Average level) before finding key support. Pay attention to this level going forward as it would be a good indicator of buying opportunities in the broader markets/stocks.
Do you want to find a team of dedicated researchers and traders that can help you find and execute better trades in 2019 and beyond?
Let our 55 years experience in researching and trading makes analyzing the complex and ever-changing financial markets a natural process. We have a simple and highly effective way to provide our customers with the most convenient, accurate, and timely market forecasts available today. Our stock and ETF trading alerts are readily available through our exclusive membership service via email and SMS text. Our newsletter, Technical Trading Mastery book, and Trading Courses are designed for both traders and investors. Also, some of our strategies have been fully automated for the ultimate trading experience.
Chris Vermeulen


