Financial Sector Paints A Clear Picture For Trading Profits
After the incredible week we’ve seen, with the Fed leaving rates unchanged and precious metals rocketing higher above their previous five-year highs, it’s time we pay attention to what’s happening in the financial sector and the US stock market majors. Closing out this week, we heard all traders and investors pay very close attention to the US dollar, precious metals, and the US major indexes.
There are a number of major factors taking place throughout the world that will likely drive future price trends over the next 30 to 60 days. Tensions in the Middle East, debt issues in China and Europe, central bank actions throughout the world and the US, and the ultimate driver of price moves – fear and greed. We’ve mentioned to a number of associates recently that our research focuses on the transition of traders from fear into greed. Our belief is that as traders begin to fear certain events or price trends, the price action tends to become more volatile. As this volatility increases and trends accelerate, traders transition this fear into greed where they attempt to take advantage of opportunities generated by large price swings.
We believe the global markets are entering a fear cycle populated by many of the issues and uncertainties we mentioned above. The fact that a number of unsettled, and potentially dangerous, global economic and political issues are taking place increases the fear component in the markets. This increased fear, and combination with increased volatility, will transition into increased greed as price trends accelerate.
Eric Sprott of SprottMoney.com talked about our recent gold and silver prediction in his recent weekly wrap-up radio show.
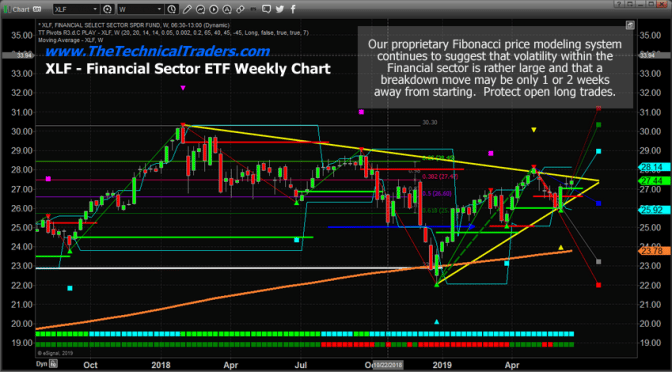
This XLF weekly chart, below, highlights a price pattern formation, the Pennant/Flag formation, that we believe is nearly complete. This price formation is setting up an apex pattern that should complete near July 12 through July 20. It is very likely that a breakout or break down price reaction will take place before July 20. Our researchers believe the dominant price trend of the breakout will be to the downside and that a possible 15 to 25% downside price move in the financial sector is likely.
This type of downside price rotation would likely push price lower, towards the November/December 2018 lows before finding support.
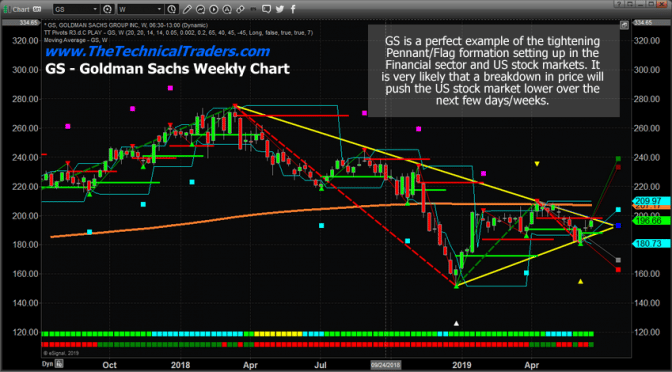
This Goldman Sachs weekly chart highlights a similar price pattern as the XLF above. When we see these types of patterns across multiple charts, it lends credibility to the overall analysis and research we are conducting. In other words, when we see the same thing setting up across multiple charts it becomes almost impossible to misinterpret. Please pay special attention to the Fibonacci projected target levels, the extended lines, and colored squares to the right of prices, to understand the type of volatility that is currently within the markets.
When volatility is narrow, price expansion or contraction is also fairly narrow. When volatility is excessive, price expansion or contraction is also labeled as excessive. Currently, in all of these charts, we are seeing price volatility, based on our proprietary Fibonacci price modeling system, in the range of 10% to 20% or more.
Our researchers believe the markets are setting up for a breakdown price swing, potentially retesting lows near November/December 2018, and shaking out the markets. It is very common for the US stock market to experience price volatility and downwards price trends 8 to 20 months prior to a US Presidential election. We’ve authored a number of articles regarding this phenomenon. As we move closer to the actual election date, prices tend to stabilize an advance as outcomes and policies become more clear.
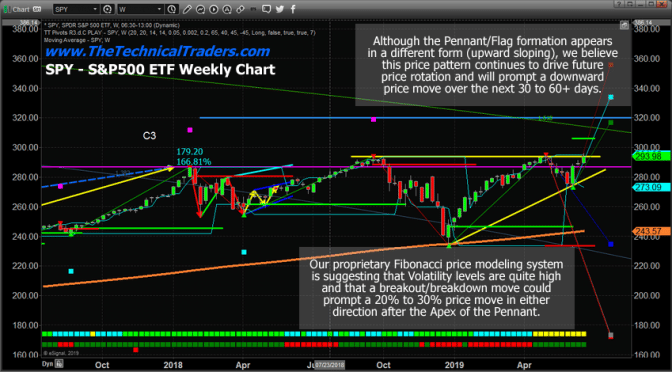
We believe a breakdown in the financial sector, as well as the US stock market, could only be a few weeks away. Our longer-term super cycle analysis suggests a possible peak in August or early September 2019. You can see from this SPY weekly chart, below, the SPY has already reached new all-time high again.
Given the dates of our super cycle research and the near completion of these pennant/flag formations, we believe the next 4 to 7 weeks of trading could be extremely volatile and attempt to create a very short term sideways flag formation on the daily charts that will prompt our price peak near the end of August or early September.
Any price breakdown in the US stock market will prompt a price anomaly pattern to set up where the price will move away from historical and predictive price ranges, base after finding support, then rally back towards new all-time highs again. Therefore, much like November/December 2018, we believe the downside rotation we are expecting after the breakout of the pennant/flag formation will react in a similar manner. We believe the next 3 to 5 weeks could be full of volatile sideways price rotation, ultimately attempting a new washed out price high in the SPY, ES, and DOW (possibly above the psychological level of $300, $3000 or $30,000) followed by an immediate -12 to -18% downside price move.
Ultimately, based on our research, the downside price move could be in excess of -20 to -25% or more. We believe the December 2018 lows will likely hold as ultimate support. Yet the reality of price volatility is that any fear/greed price swing could move well beyond these lows while attempting to hammer out a bottom.
We urge all traders to be very cautious over the next 3 to 5 weeks. Ultimately, this upside price swing will likely end near the psychological levels we’ve suggested and, as fear turns into greed, price rotation will likely push the global markets dramatically lower starting sometime in August or September 2019. This means we have about 5 to 7 weeks of volatile sideways trading near a pennant/flag apex that will likely result in large price rotation and the set up of a shorter-term pennant/flag formation on Daily charts. We believe this short-term pennant/flag formation set up will create the ultimate peak in late August or early September and prompt the larger downside move we are expecting.
Skilled traders will not get married to their long positions or short positions until this washout volatility is completed and tends really begin to take shape. Our advice to skilled traders is to expect some increased volatility, some wild price rotation, and a shakeout new-high, new-low type price formation (setting up the new short-term pennant/flag pattern) over the next few weeks. This is really becoming more of a traders market where short-term targets and trades will be keys to success. Longer-term trends and trend following systems will likely get chewed up over the next 45 to 65+ days.
Our super cycle research has given us a very clear picture as to what to expect over the next 24 months or longer.
We have a good pulse on the major markets and can profit during times when most others can’t which is why you should join my Wealth Trading Newsletter for index, metals, and energy trade alerts. Visit our website to learn how you can see what this research is telling us.
I am going to give away and ship out silver rounds to anyone who buys a 1-year, or 2-year subscription to my Wealth Trading Newsletter. You can upgrade to this longer-term subscription or if you are new, join one of these two plans listed below, and you will receive:

1oz Silver Round FREE 1-Year Subscription
TWO 1oz Silver Rounds FREE 2-Year Subscription
SUBSCRIBE TO MY TRADE ALERTS AND
GET YOUR FREE SILVER ROUNDS!
Free Shipping!
Chris Vermeulen