Fibonacci Price Ladder Points to Pullback then Rally
We continue to appreciate the positive and supportive comments we are receiving from our followers and members. We can’t tell you how pleased we are that all of you are enjoying our efforts to provide you with the best market research and analysis we can offer. Today, we are highlighting some important Fibonacci price levels and how they should continue to drive price action over the next 3~10 days or so. Let’s get started.
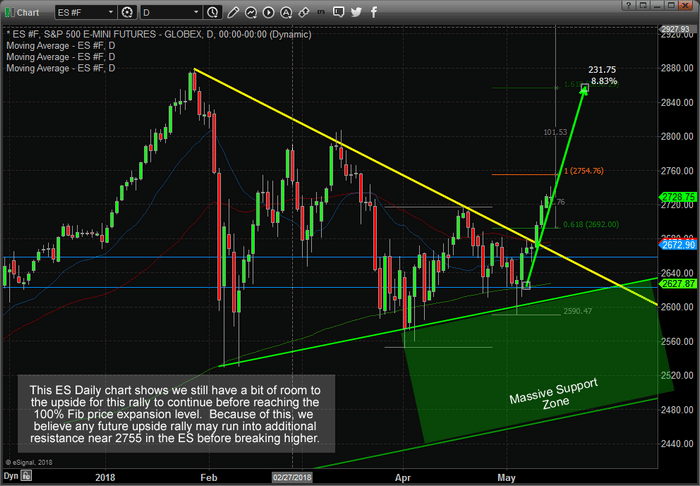
This first Daily ES chart shows a pretty big picture of the Fibonacci price legs (the Fibonacci price “ladder” as we will refer to it in this article) and how these legs work in tandem with other types of support and resistance channels/level as price expands or contracts within new trends. As you probably remember, one of the key factors to understanding Fibonacci price theory is that “price MUST attempt to establish new highs or lows at all times”. Therefore, as we can see by recent price action, new price highs have been reached. This is a clear indication that a new bullish trend is in place and we should now be searching to key levels to enter new trades.
We know the massive support zone exists below 2620 in the ES and we know a critical price channel exists between 2625 & 2660. We don’t believe price will retrace enough to threaten any of these levels. We believe price may retrace to near 2700 before finding additional support and developing a new base for a “ladder move” higher (likely to near 2855).
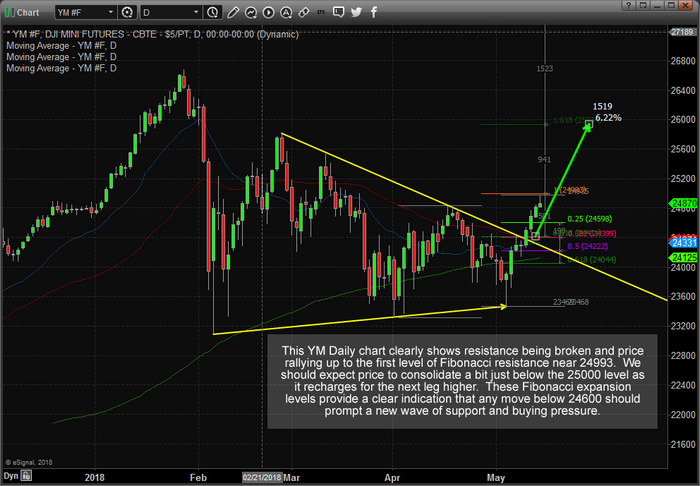
To confirm this analysis lets take a look at the YM (DOW futures) Daily chart below as well. The Daily YM chart, below, paints a fairly similar example as the ES (S&P500 futures) chart, above). Yet, this YM chart shows that the recent high price is very close to the Fibonacci 100% price level (a “ladder rung”) and should find moderate resistance near this level (24993). We expect price may rotate lower to near 24598 before finding support and establishing a quick, possibly V-shaped or large lower wick type price rotation, bottom that would propel price higher to the next Fibonacci ladder leg near 25937.
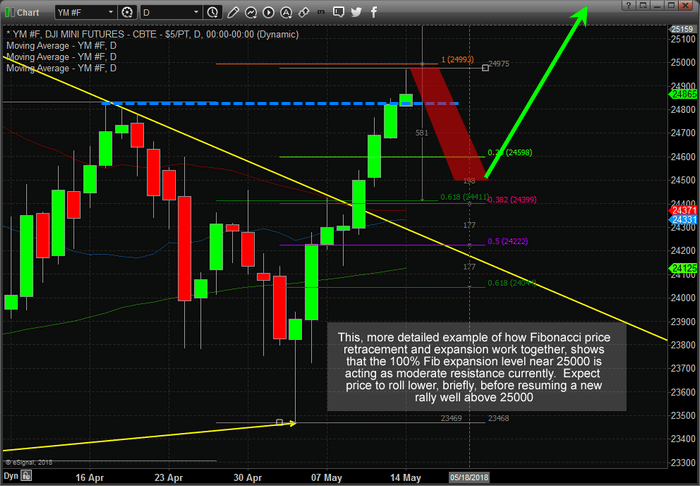
This, zoomed in view of the Daily YM price chart below with our Fibonacci price levels drawn, helps to better understand what we expect to see. As we keep trying to instill into your thinking, “price MUST attempt to establish new price highs or lows as it continues to develop trends and trend reversals in Fibonacci Theory”. Therefore, price MUST attempt to rotate lower after establishing a new price high (as it has done recently) only to FAIL to establish a new price low (which would be a move to below 23460 – a long way away). In doing so, the failure to establish a new price low (through price rotation) would indicate that price MUST do what? That’s right, establish another NEW PRICE HIGH.
It is our belief that any price rotation below 24700, when price appears to be holding or forming support, would be a tremendous opportunity to identify new long entries. Of course, the deeper the downside move, the better the entry levels will be created, but we don’t believe this future downside price rotation will be very deep – possibly just below 24500 as the lowest points for the YM.
If you have been following our research and analysis, you know we called this move nearly a month ago and have been sticking to the analysis of our advanced modeling and predictive analysis systems.
We offer some of the most complete and informative research anywhere and we invite you to visit www.TheTechnicalTraders.com to learn how we can help you find and execute better trades. Your subscriptions help us continue to deliver these incredibly valuable research reports and we urge you to consider how our work has helped you over the past few months. If you feel our work is superior and valuable, then support our research team and start using our research. 2018 is proving to be a fantastic trading year and we urge everyone to join us in creating greater success.
Our articles, Technical Trading Mastery book, and 3 Hour Trading Video Course are designed for both traders and investors to explore the tools and techniques that discretionary and algorithmic traders need to profit in today’s competitive markets. Created with the serious trader and investor in mind – whether beginner or professional – our approach will put you on the path to win. Understanding market structure, trend identification, cycle analysis, volatility, volume, when and when to trade, position management, and how to put it all together so that you have a winning edge.
Chris Vermeulen