Emerging Markets Could Be Starting A Relief Rally
Over the past 4+ months, many emerging markets have come under pressure as the global markets were roiled by the sudden and relatively deep market retracement in early February. For many, this downward price trend has been frightening and somewhat disastrous. Recently, though, something new appears to be on the horizon that may be the early signs of renewed life for many Latin American, South American and Indian markets – early signs of support and a potential bottom formation in the works.
Our researchers have been following the recent moves in these emerging market ETF for Brazil, Latin America, and India with great interest because we believe in finding opportunities when many others may not be looking for them. We believe these early warning stages of a market bottom could be an excellent time to “forward think” any possible price recovery that may occur in the near future and to prepare for any success opportunities that may arise. Heck, we are traders and if the opportunity exists for a decent profit with little risk, we’ll investigate it.
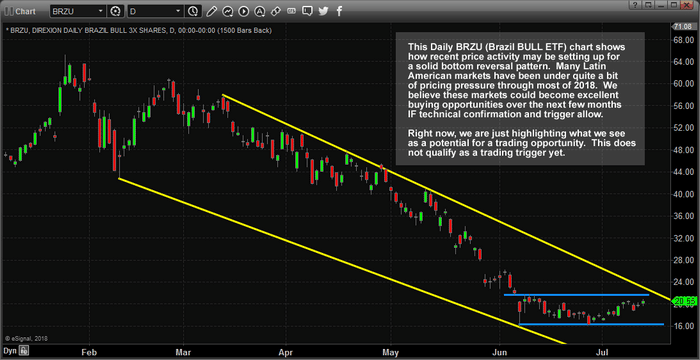
Let’s get started with this Daily chart of the BRZU (Brazil Bull 3x ETF). We can see from this chart the extended downtrend channel that has existed for nearly 4 months. Near the bottom right side, pay close attention to the horizontal price channel that is setting up – this could be an excellent bottom rotation channel resulting in an upside breakout eventually. With only 3 to 7 days to go before the upper price channel may be challenged and a clear double bottom formation near $16, any downside rotation below $17.50~18 would be an excellent buying opportunity range with $16 being our protective stop level. Assuming this channel continues as price reaches this apex, at some point price will either rotate higher or continue to channel lower (below the $16 level). So, buying near the lower range of this horizontal price channel may be a great opportunity for an upside move.
Additionally, the GAP between $26 and $28 is a clear upside target. We would hope this move would be quick and simple, buy below $18 with a target above $26. A quick $9 profit per share (50%+) and we could manage the remainder of our trade by moving our stop to $23 or $24 to protect against any unwanted losses.
Yet, in order for this trade to really have any teeth, we would need to see some correlation across multiple emerging market ETF. Then we could really say that we may be seeing some type of bottom rotation starting to form. Let’s look for more correlative signals.
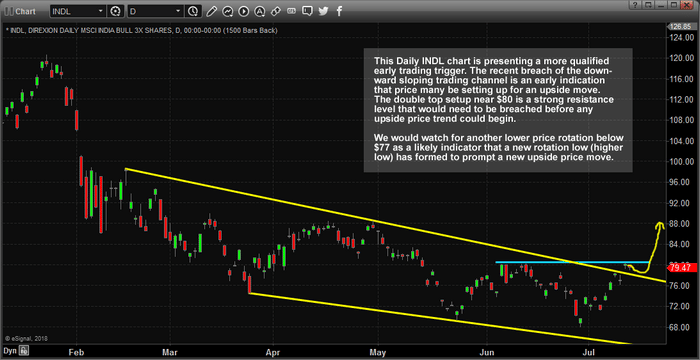
This next chart is a Daily INDL (India Bull 3x ETF) and it is showing a similar pattern that has recently broken above the downward sloping price channel. This is a good sign that price may be attempting a rotational upside move in the near future. Yet, upon closer inspection, we can see that a double top is setting up $80 that may unsettle this move. Additionally, the range of the price channel is rather deep – $68 to $80. That $12 range may include a bit more RISK than we want to consider at the moment. Certainly, this trade looks like it may have some potential, but there are still concerns that this trend may be a false flag type of move.
We would like to see more pronounced and defined “higher low” rotations in the process of creating this double top formation. Currently, we have a few moderate higher low setups, but the deeper low near the end of June is concerning. Ideally, we would wait for a low price move below $72~74 and watch for price rotation back to the upside as a better sign that price is “technically conforming to Fibonacci price rotation theory”.
Still, this pattern is setting up as resistance near $80 with a clear sign that a bottom could be forming in INDL at the moment. Our opinion is to watch it and wait for a better setup before taking a position. We believe we can identify a better entry point by waiting for price to show us it is ready to move higher instead of presuming this rotation WILL move higher.
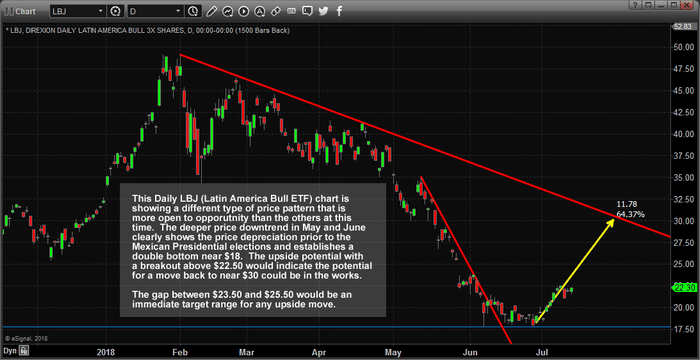
Lastly, let’s take a look at this LBJ (Latin America Bull 3x ETF) Daily chart. We find this chart very interesting for one simple reason – the big “U” shaped bottom formation near $17.50 and the clear upside price swing that is taking place right now. You can clearly see the RED price channel slopes that are key to understanding price resistance and the more aggressive downward slope that was breached in mid-June. Yes, should this ETF rally back to near $30 from this level, we would be looking at a 50%+ increase in value. Yet, again, we have to learn to be patient and wait for the price to show us that it is preparing for an upward swing higher.
As of right now, we have “higher highs”, which is a great sign that the trend has changed to the upside. Yet, we also have a clear GAP between $23.50 and $25.50 that could become immediate resistance. We also don’t have any “low price rotation points” that we can use as a technical confirmation of price trend and price rotation. In other words, we have what may be an impulse move higher with no real confirmation of longer-term upside potential.
We would caution investors from jumping into this trade at this time and urge them to wait for better confirmation – likely after the breach of the price GAP is filled and price rotates back below, or near to, $20. Short and simple, this is a very interesting bottom formation in the works that has not qualified as a solid uptrend yet. There are still too many unanswered concerns to allocate capital towards this trade.
While all of this is interesting and possibly a bit early in terms of bottom formation expectations, we believe the correlation across these multiple markets shows enough evidence of a potential emerging market bottom in select markets as it relates to these under performing Latin American and Indian markets. Obviously, we still have to be cautious of any downside rotation that could be dangerous – these percent ranges still show quite a bit of risk. But the upside potential for a perfectly timed entry may be just around the corner.
Want to learn more about what we do and how we help traders find success in the markets? Visit www.TheTechnicalTraders.com to learn how our research team, with more than 50 combined years of trading experience, can assist you in finding tremendous trading opportunities each month as well as provide you with detailed market research, Daily market videos and much more. Our job is to help you find and execute successful trades in the future and to help you stay aware of future market moves.
Visit www.TheTechnicalTraders.com/FreeMarketResearch to see how our research team has been ahead of these turns in the global markets for the past 8+ months. We have an incredibly deep research library of posts available to all members/visitors at the link above. We are certain you will find value in our work and our abilities to accurately predict the markets. We’ve been calling for upside price moves in the US Equities markets since the middle of February when everyone was warning about a collapse. We called the downtrend in China months before it happened and we recently called the downward rotation in Crude 4 days before it happened.