Dow Jones E-Mini Futures Tag 30k Twice – Setting Up A Double Top
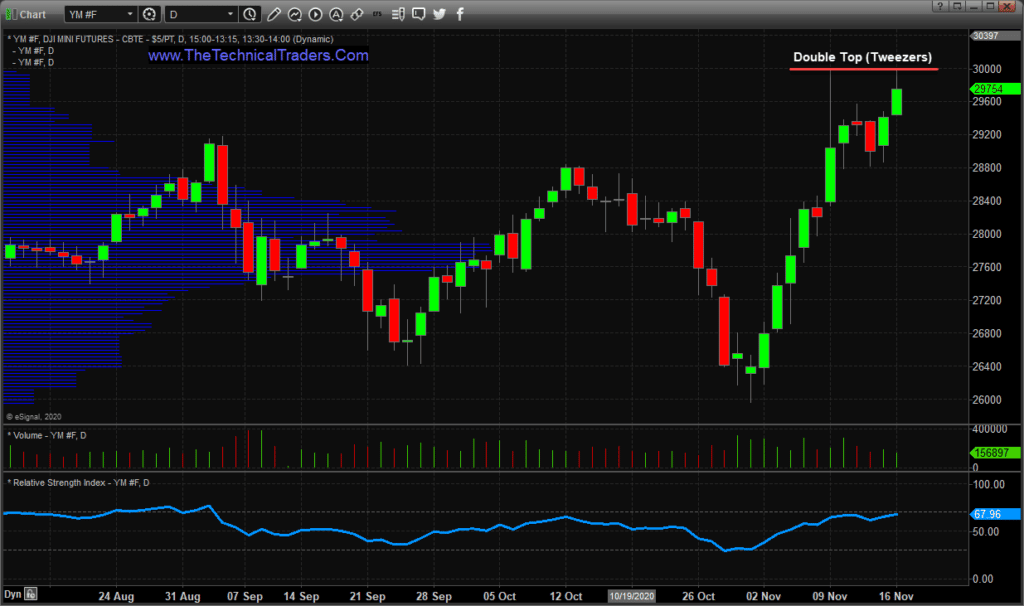
Sometimes the markets telegraph a key level or future target level in pre-market or post-market trading. Other times these telegraphed price targets happen during regular trading hours. Recently, the Dow Jones E-Mini Futures Contracts (YM) generated two unique high price levels near $30,000 over the span of about 6 trading days.
My research team and I believe this “telegraphed high price target level” is a warning of major resistance for traders. These types of broad market patterns are not very common on charts. They happen sometimes, but very rarely like this example on the YM chart below. This Double Top (Tweezers) pattern may be warning that the $30,000 level on the YM could become a major market peak/turning point. Additionally, the post election rally reached this $30,000 level on the day Pfizer announced the vaccine data, then sold off quite consistently throughout the regular trading session.
TWEEZER TOPS NEAR $30,000 WARN OF STRONG RESISTANCE
Obviously, traders are attempting to redeploy capital into sectors they believe present real opportunities for growth and appreciation. As we can see from the chart below, the Dow Jones and Mid-Cap sectors appear to be the leading sectors at the moment. We’re not calling for a major top in the market based on this pattern (yet). We are just bringing it to your attention so you can be aware of the resistance level that appears to have setup near $30,000 on the YM.

The market could blow through this $30,000 level and continue to rally higher or it could stall near the $30,000 level and retrace lower. Given the situation with the US election and the surging COVID-19 cases throughout the world, it doesn’t take much of an imagination to consider another shutdown related market decline setting up.
If you read our recent article about the US stock market and gold price appreciation/depreciation phases, you will see how my team believes the US stock market entered a depreciation phase in mid-2018 and the current rally in the markets (2019 till now) is an excess phase “blow off” rally in the works. If our research is correct, we expect the excess phase to end at some point in the near future, setting up a broad market correction and/or broad sideways rotation. In the meantime, the rally appears to continue with a near-term target of $30,000 (only 250 points away).
Learn how I can help you find and execute better trades. I can help grow your trading account with my Swing Trading service and protect your investment account with my long-term market signals service. Visit www.TheTechnicalTraders.com today to learn more!
Chris Vermeulen
Chief Market Strategist
www.TheTechnicalTraders.com
NOTICE AND DISCLAIMER: Our free research does not constitute a trade recommendation or solicitation for readers to take any action regarding this research. It is provided for educational and informational purposes only – read our FULL DISCLAIMER here.

