Double Top In Transportation and Metals Breakout Are Key Topping Signals
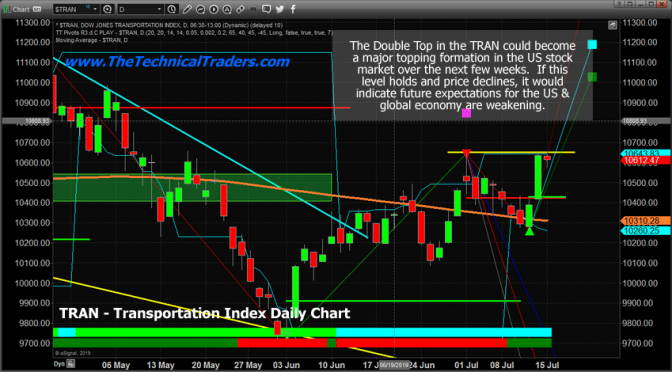
Our researchers identified this critical Double-Top pattern in the Transportation Index after a very strong price rally on Friday, July 12. Double-Top patterns are very important in terms of Fibonacci price structure because they reflect a complete price rejection at a certain price level. In this case, the TRAN Double Top level is $10,655 and our research team believes weakness at this level will push a downward price swing which should attempt to break through the $10,250 level and possibly attempt to move much lower. Read Part II – My Cycle Analysis Article Next!
The Transportation Index reflects future expectations for shipping of goods and raw materials across the US and, of course, is somewhat related to global economic activity. If the Transportation Index falls in price, then future expectations are for weaker economic activity. If it rises, then investors expect the economy to continue to strengthen.
This Double-Top formation in the TRAN could set up to become a very ominous warning sign for traders and investors.

Recent news about the contraction of China’s economy and the fact that Q2 earnings are about to hit the US markets and global markets could become a key factor in the future for volatility and price. We believe the markets are already setting up a topping pattern after breaching key psychological levels last week.
MINERS ARE OUTPERFORMING US EQUITIES – TOP IS NEAR!
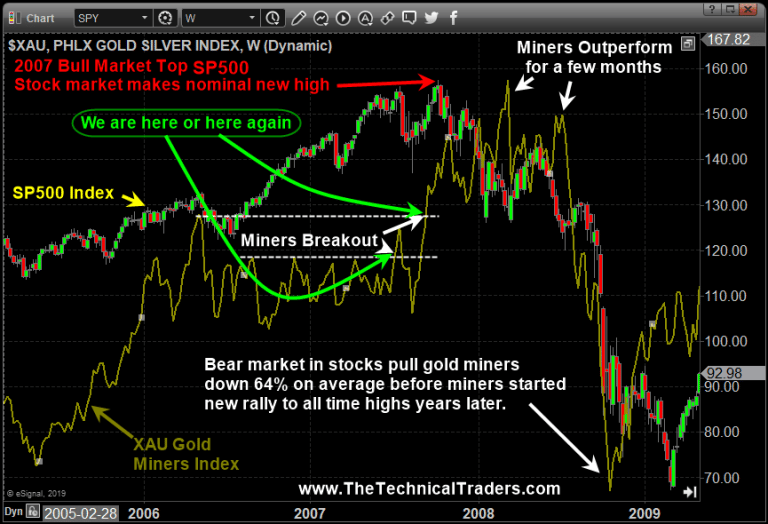
Last month I talked about how I have been waiting for gold miners to start outperforming the US stocks market. Once miners start outperforming in a big way (just like we saw in 2007), we know the stock market is topping out and something really bad is about to happen.
In the last couple of weeks, the gold miners index is up over 20% while the SP500 is up only 4%, this feels like the start-of-the-end if you know what I mean.
Gold miners and silver broke out today in a big way which could very well be the start of an epic rally for the precious metals sector as we heading into the end of the year.
Looks at the SP500 index in the chart below which is of the 2007 bull market top. Currently, the SP500 has formed a very similar pattern in 2019 and with the precious metals rocketing higher I think it almost lights out for the US equities.

See my updated chart showing where gold miners and the stock market is today within this cycle: https://thetechnicaltraders.com/next-bull-and-bear-markets-are-now-set-up/
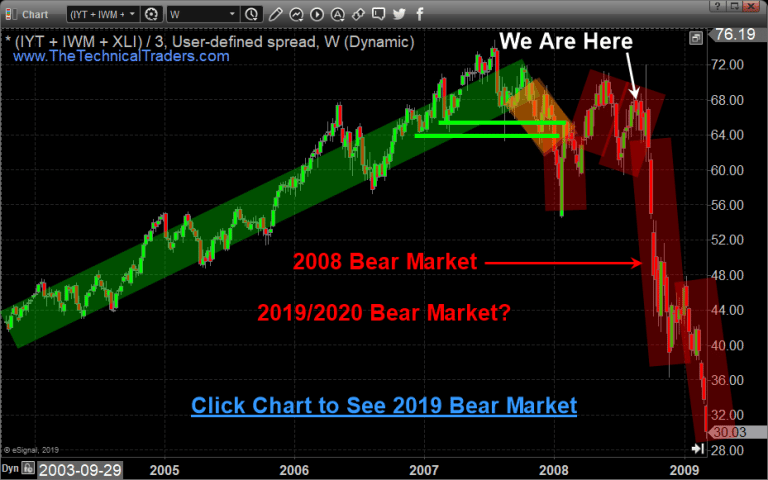
TRANSPORTS, INDUSTRIALS, and SMALL-CAP STOCKS Confirm Market Is Topping
Based on the 2008 weekly chart below the US stock market could be literally 2-6 weeks away from collapsing. What makes this even scarier is that the market liquidity is the worst its been in my 23 years of trading. This means when the selling starts we will likely see some sort of flash crash as we saw in 2008, 2015, and 2018. Price drops so quickly that by the time you figure out what you want to do and get your money properly positioned most of the move is already finished. See 2008 and 2019 Comparison Charts here.

CONCLUDING THOUGHTS:
Pay attention to our research because we feel the market could breakdown on weakness later this week or early next week. Our predictive modeling systems are suggesting an August 19th, 2019 breakdown date and we are only about 25 trading days away from that date.
In short, the bear market has been a long time coming, but finally, almost all the signs are showing that it’s about to start. As a technical analyst since 1997 having lost a fortune and making a fortune from bull and bear markets I have a good understanding of how to best attack the market during its various stages. Read Part II – My Cycle Analysis Article Next!
Be prepared for these incredible price swings before they happen and learn how you can identify and trade these fantastic trading opportunities in 2019, 2020, and beyond with our Wealth Building & Global Financial Reset Newsletter. You won’t want to miss this big move, folks. As you can see from our research, everything has been setting up for this move for many months – most traders/investors have simply not been looking for it.
Join me with a 1 or 2-year subscription to lock in the lowest rate possible and ride my coattails as I navigate these financial market and build wealth while others lose nearly everything they own during the next financial crisis. Join Now and Get a 1oz Silver Round or Gold Bar Shipped To You Free.
I can tell you that huge moves are about to start unfolding not only in currencies, metals, or stocks but globally also and some of these supercycles are going to last years. We go into great detail with this simple one of a kind and a real eye-opening financial market research booklet full of timely charts.
As a technical analysis and trader since 1997, I have been through a few bull/bear market cycles. I believe I have a good pulse on the market and timing key turning points for both short-term swing trading and long-term investment capital. The opportunities starting to present themselves will be life-changing if handled properly.
FREE GOLD or SILVER WITH MEMBERSHIP!

So kill two birds with one stone and subscribe for two years to get your
FREE PRECIOUS METAL and get enough trades to profit through the
next metals bull market and financial crisis!
Chris Vermeulen – www.TheTechnicalTraders.com

