Commitment of Traders (COT) Data Suggests Gold In Rally Mode
Many people believe the price of Gold will need to fall to support Institutional short positions. We don’t believe this is the case. The Commitment Of Traders (COT) Data suggests Commercial Hedgers have a large and growing shot position that is a very positive sign for a continued rally in Gold and Miners looking forward months from now.
Don’t think about COT data like everyone else with it comes to gold.
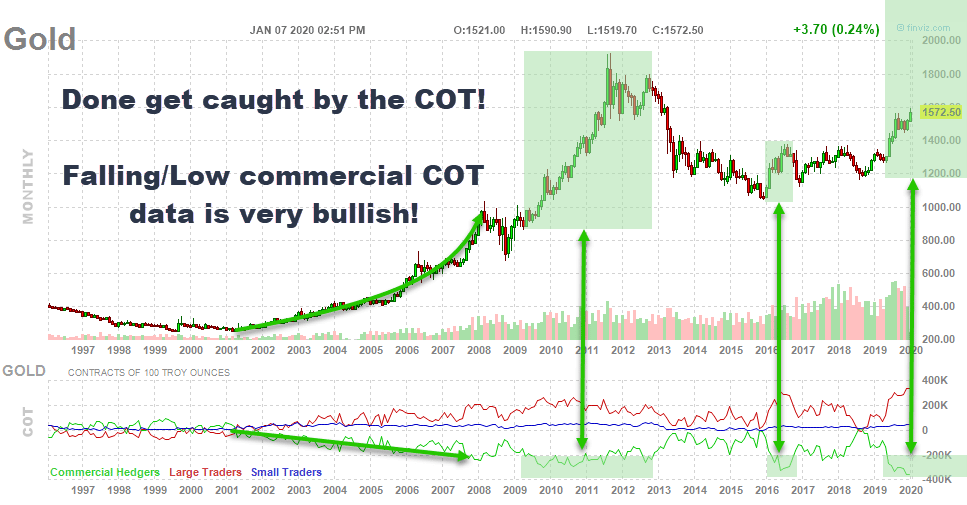
Over the past 20+ years, every time the COT Commercial Hedgers position in Gold falls, weakens substantially, or makes new multi-year lows the price of gold rallies.
Why record commercial short hedge position is bullish
It is my belief that the markets will move in favor of where the big money (commercial/institutions) want it to go in most cases. so if the commercial’s keep adding a short hedge position that means they are adding to heir long exposure and need to add more of a hedge to help protect their growing LONG position.
The weakening COT data from 2001 through 2012 is a perfect example. As Commercial Hedgers moved away from Gold, the price of gold rallied to the all-time highs.
Additionally, after the major bottom in Gold in 2016, Commercial traders would have bought and accumulated gold driving the price higher.
Now, in late 2018 and throughout all of 2019, the Commercial Hedger COT position in Gold has fallen to the lowest level in the past 20+ years. This suggests the rally in Gold has really just begun to accelerate to the upside and there are more people buying gold than ever before who are buying protection (hedging)
The COT data I find very deceiving because it’s displayed and delayed in a way that makes traders and investors think the opposite.
Wall Street is in the business of making a market, and that means they play a game of deception so you do the opposite of what they are doing. Wall Street show As you watch gold moving with your new view on the COT data, you will notice gold will rally and post strong moves, then a couple of weeks later the COT data comes out.
With all that said, this is just my view and opinion of how I read the COT data for gold specifically. As with every chart and trader, there are many different ways things can be analyzed and viewed.
Since the price just had a strong advance, and you now see the commercials have added to their short position you naturally expect a pullback after a price rally especially when you see the big players adding to their short/hedge position. But what really just happened? the big players bought gold, and they had to hedge some of their new position. Very bullish in my opinion. While I do not use it for trading, it is a good confirming indicator of a trend.

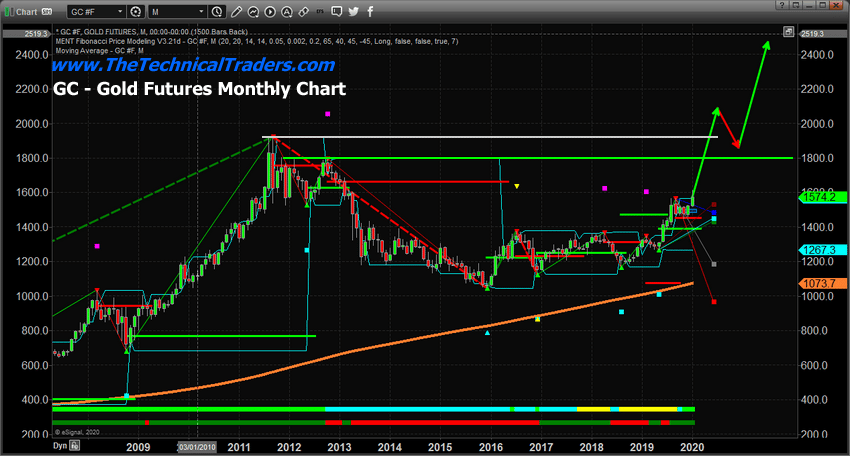
Our research team, as well as our proprietary price modeling systems, suggested that Gold may rally to levels above $3700 before reaching an ultimate peak. Currently, our predictive modeling systems are suggesting the next target is well above $1600 and we believe our original target from our October 2018 analysis, of $1700 to $1750, is still very valid.
We believe this current upside price rally in Gold will attempt to clear the previous high levels near $1924 – from September 2011. We believe moderate resistance/rotation near $1700 to $1750 will be the last level of price resistance before a continued rally will push Gold prices above the $1924 peak – possibly stalling just below $2100. Once price breaches the previous high level, we expect a short period of price rotation before another upside price acceleration takes Gold prices above $2400 to $2500.

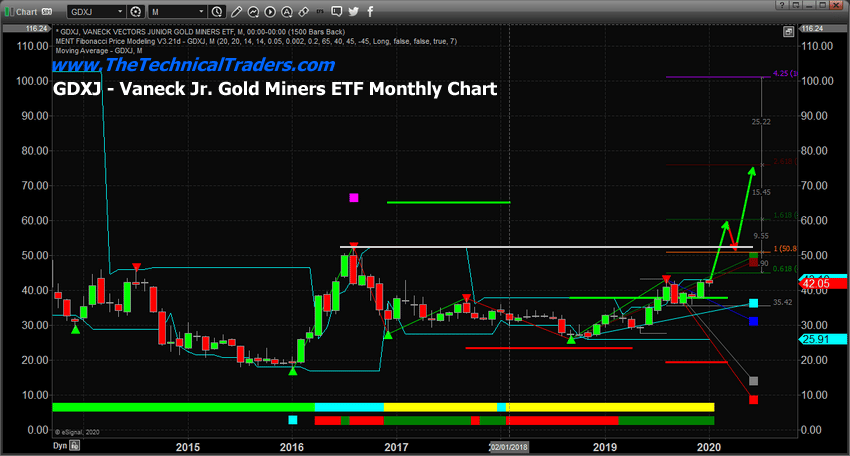
Gold Miners are poised for an incredible upside price rally if our analysis of Gold is accurate. GDXJ is currently trading near $42 – showing moderate weakness while Gold has seen some strength this week. We believe Miners will do very well once Gold really breaks out above $1750 and begins to target the previous all-time high level.
Much like our expectations for Gold, we believe GDXJ will rally to levels near $60 once this current overbought condition wears off. Then we expect it to head towards $60 and rotate lower for a few weeks before attempting to rally further to levels above $70+.

Take a minute to review some of our recent Gold research posts to gain further insight
January 2, 2020: ADL GOLD PREDICTION CONFIRMS TARGETS
December 30, 2019: METALS & MINERS PREPARE FOR AN EARLY 2020 LIFTOFF
December 4, 2019: 7 YEAR CYCLES CAN BE POWERFUL AND GOLD JUST STARTED ONE
You won’t want to miss this incredible run in Precious Metals and Miners. Follow our research. Learn how we can help you find and execute better trades. We’ve been warning all of our followers of this move for months – now it is about to get very real. In fact, we are giving away free silver and gold bullion bars to all new subscribers of our trading newsletter!
As a technical analysis and trader since 1997 I have been through a few bull/bear market cycles, I have a good pulse on the market and timing key turning points for both short-term swing trading and long-term investment capital. The opportunities are massive/life-changing if handled properly.
I urge you visit my Wealth Building Newsletter and if you like what I offer, join me with the 1 or 2-year subscription to lock in the lowest rate possible and ride my coattails as I navigate these financial markets and build wealth while others lose nearly everything they own.
Chris Vermeulen
www.TheTechnicalTraders.com

