Bombs, Missiles and War – What to expect from the stock market next
Friday night opened up a whole new perspective on the global markets with the coordinated targeted attack on Syria. It’s not that we didn’t know this was a possibility, yet the event itself changes how the markets may react on Monday and throughout this next week. Our researchers at Technical Traders Ltd. have been diligently trying to identify the price rotations that will occur early next week and we believe this research post will help to prepare all investors for what may be a wild ride.
First off, with this event playing out late Friday night and early into Saturday, there are a number of things we have to consider. The US Dollar may be under some pressure this week as a result of this event. Gold and Silver may rally as fear and panic enter the markets. Oil will likely rise on fear of a disruption or conflict related supply issue. The US stock market will likely rotate with a bit with continued large price volatility early Monday morning as traders attempt to reposition after this event. Given all of this, the long-term perspective has to be maintained in order to understand the true market dynamics.
As we understand it, this event was a “shot over the bow”, so to say, with regards to the players in Syria and the fact that chemical weapons attacks will not be allowed to continue. Syria is an absolute mess with multiple parties attempting to develop alliances and dominate the narrative of this conflict. The US involvement started quite a while ago and we believe the US will attempt to stay as far away from direct engagement as possible with regards to this ongoing event
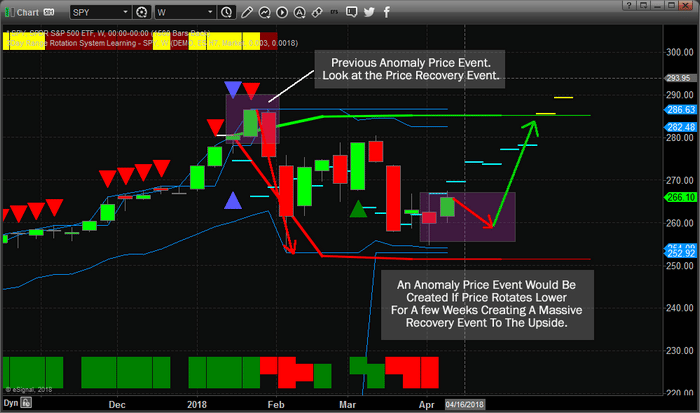
As traders, we have to understand that this type of isolated event may create price anomalies in the markets that present incredible opportunities for smart investors. Our ADL price modeling system is still warning us that the US markets should be headed higher over the next 3~5 weeks. How does this event in Syria change these predictions? It doesn’t. It just means that pricing pressure because of this event may create what we call a “price anomaly” that allows us to position our trades for the “recovery event.
This SPY chart illustrates what we believe will be the most likely outcome. If investors panic and rush into the US markets, then we could see a broad market rally early this next week. If investors panic and attempt to rush into a protectionist position, then we could see the US majors consolidate near these lower price ranges for a few weeks setting up the “price anomaly” we have been discussing. Either way, we believe the markets will attempt a massive upside move in the near future because our advanced price modeling systems are showing a clear upside bias as well as the fact that capital will always move into safe and stable environment for returns. The US and other established markets are really the only places where capital will attempt to reside if this conflict extends much further.
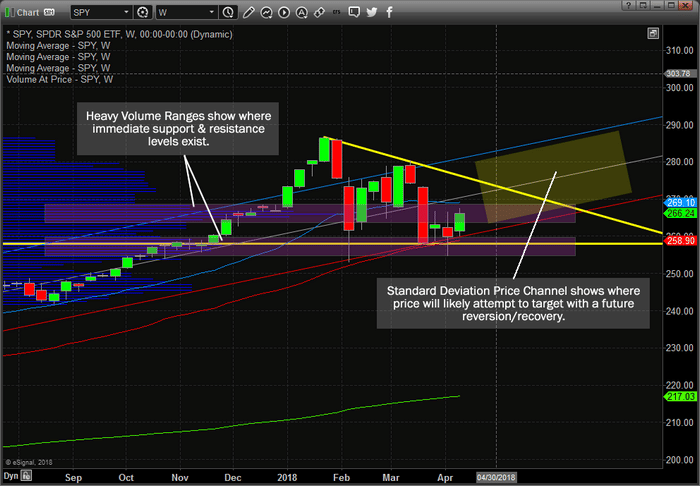
This additional SPY chart shows a number of key technical elements; the Standard Deviation Price Channel and the key Volume Support & Resistance zones. These are important for all traders to understand, the Volume Support & Resistance zones are key to understanding the current price consolidation range. These levels are going to continue to be price boundaries till price breaks these levels and attempt a move higher or lower. The Standard Deviation Price Channel is also key to understanding that price will attempt to “recover” to this level at some point – unless some massive market event disrupts this channel and creates a new price channel. We believe the markets have not accomplished this disruption event yet and the current price channel is still valid.
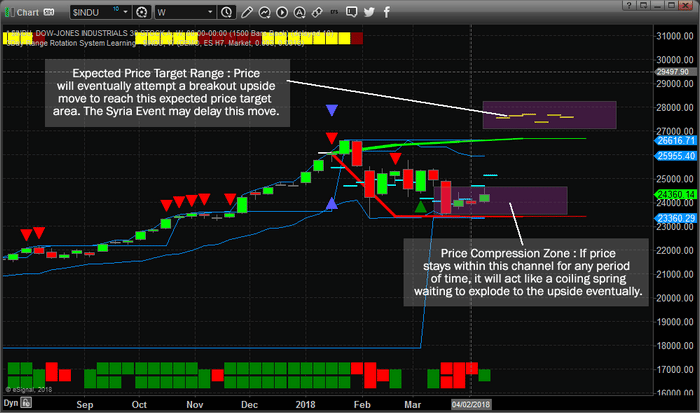
This $INDU weekly chart provides a much clearer example of the ADL price modeling system at work and what we believe could be an explosive upside price move within the next 3~5 weeks. See how the ADL price modeling system is predicting the “Expected Price Target Range” much higher than current price levels? If the Syria event continues to hold prices down in the illustrated “Price Compression Zone”, then the reactive recovery event for price will be an explosive upside price swing in the near future. These are the types of anomalies that we look for in our analysis. They can be very powerful and very profitable if one knows how to position selected trades to take advantage of these moves.
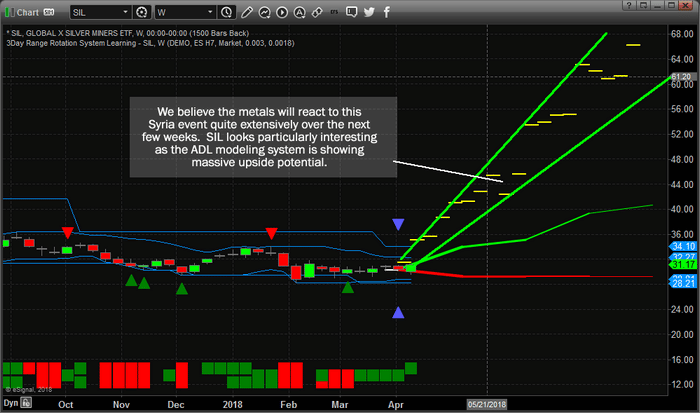
Lastly, this one chart sums up our metals analysis quite well. The Syria event is probably not over yet and the world’s powers will continue to control the narrative of this event for quite a while. What we can determine from this is that some level of additional fear will likely reenter the markets which means that Metals and Oil will likely move higher as this fear comes into play. This SIL Weekly chart shows that our ADL price modeling systems is predicting substantially higher prices over the next 3~12+ weeks. Many people have discussed that Silver is the poor man’s Gold and the disparity in pricing between Gold and Silver makes Silver a substantially advantageous commodity to own. If this ADL price modeling is correct, Silver and SIL will begin to skyrocket higher over the next few weeks and months as capital, which is always searching for a safe and viable environment for returns, hunts for the best protected areas of the market for continue ROI growth. Where will it go?? Probably into the US equities, metals and oil.
Remember, with events like this, there is not a single person on the planet that can attempt to predict the future with any degree of accuracy. Even our own price predictive modeling systems can’t be 100% accurate all the time. We have to consider all perspectives of these markets and when we get more than one analysis that confirms our primary research, then we have a better understanding of what might happen. What we can tell you is that our team of researchers are dedicated to helping our members stay ahead of the markets and find suitable trading opportunities for success. Our analysis and price modeling systems have been dead-on accurate through almost all of 2018 and late 2017. Our analysis is saying that we have to watch what happens early this week to see which of the two expected price reactions are going to play out and make decisions based on what price is doing then. Still, we have a plan to execute positional trades for our members to allow them to profit from these moves either way and we believe the opportunity for success is incredible.
If you want to learn how to take advantage of these types of opportunities and market anomalies with stock and ETF trade alerts, then visit www.TheTechnicalTraders.com and see what we have to offer. Start off with our Quarterly membership to give yourself ample time to see how we find and deliver success for our members. Remember, these moves don’t always play out like we expect, we will be updating our members with new research as the markets show different setups in the future. Right now, we’ve shown you what will likely happen for the next 3~5+ weeks and we are uniquely positioned to take advantage of these moves. If you feel you are in need of our assistance, then please visit www.TheTechnicalTraders.com to learn how we can assist you in profiting from these massive price swings.