President Trump Signs Additional COVID Relief – What To Expect from the Markets
Up until the end of the last week, Republicans and Democrats were locked in heated negotiations regarding the size and scope of pending COVID-19 relief efforts. Our researchers had little hope that any negotiations would be successful given the two sides were so far away from one another in terms of wants and wishes.
On Saturday, August 8, 2020, President Trump signed a new Executive Order (and memorandums) to provide additional relief from the coronavirus that continues to spread in the US and around the world. These measures provide for as much as $400 in enhanced unemployment payments, and also offer Americans with temporary payroll tax relief, student loan deferments, and assistance to homeowners and renters.
NEW EXECUTIVE ORDER – WHAT TO EXPECT
The markets, meanwhile, continued to “Melt-Up” over the past few weeks with the SPX500 briefly reaching into new all-time high territory before selling off on Friday. In all likelihood, given news of the Executive Orders issued by President Trump yesterday, the markets will likely view this a reprieve from the mounting pressures that lie just under the surface of the US economy.
We believe there is a very strong likelihood that the US and global markets will interpret the newly signed relief efforts positively, resulting in a strong potential for a continued “melt-up” over the next few days/weeks. Investors and traders have been banking on the fact that the US Fed and Congress would do everything possible to support the US economy and the millions of displaced workers who find themselves suddenly unemployed.
We want to point out there is a huge unknown factor that is lurking just below the surface of the sky-high market valuation levels – those individuals who have entered a forbearance or deferment programs designed to alleviate the economic and accounting collapse associated with the COVID-19 virus event. Quite a bit of this very unusual effort has been detailed in this Wolf Street article where the author itemizes dangers within the household credit markets.
The reality is grim: hundreds of billions in student loans, auto loans, and mortgages have been deferred, while the number of unemployed jumped to 32.1 million at the start of August. Instead of facilitating these losses through traditional channels, new forbearance and deferment programs, including that from these latest Executive Orders, have shifted these extensive, looming liabilities into the “performing loans” category on banks’ balance sheets so everything seems rosy for investors.
We believe we are witnessing the most incredible economic phenomena unfolding since the roaring 20s. We have gotten to a point where traditional accounting doesn’t seem to matter as long as the ship is still floating. Put a fresh coat of paint on it and call it good – who cares about fundamentals and whether the ship is structurally sound or not.
Be sure to opt-in to our free market trend analysis and signals now so you don’t miss our next special report!
For skilled traders, this is one of the most challenging, yet exciting, times to be in the market. We are navigating a new open sea where the conditions are changing almost every week. Gold and Silver have already started screaming that risks and excesses are FULL-TILT. Daily volume is starting to slow down on many charts and many of the major indexes are nearing the February 2020 highs. The markets are either going to continue to melt-up for a while or digest this new COVID-19 relief package as a real concern for what the markets will look like near the end of 2020. Our researchers believe the “melt-up” scenario is the most likely outcome, but we don’t believe it will last more than two to three weeks before reality sets in.
TRANSPORTATION INDEX CONSOLIDATION AND BREAKOUT PATTERNS
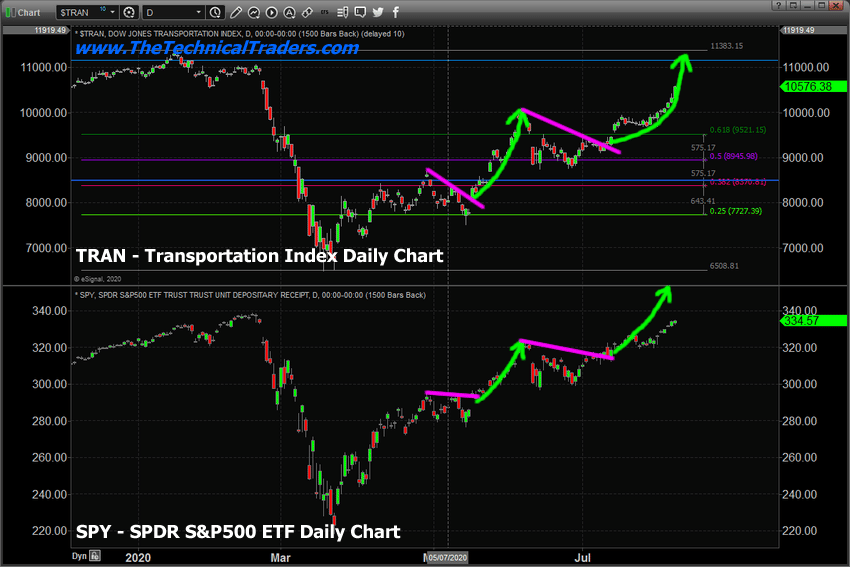
The Daily TRAN/SPY chart below highlights the consolidation and breakout rally mode that has continued to set up in both the TRAN and SPY. We believe the current rally may continue for a few more days before another consolidation pattern sets up. We’ve discussed “measured moves” as a common technical analysis technique. The Transportation Index has moved 1825 to 2000 points in each of the three upside measured moves from the March 20 bottom. Each of these moves has happened after a consolidation breakout pattern. Currently, the TRAN has already moved in excess of 1900 points from the last consolidation breakout pattern. Thus, we strongly believe a further melt-up may only offer 100 to 250 upside points before a new consolidation pattern begins.

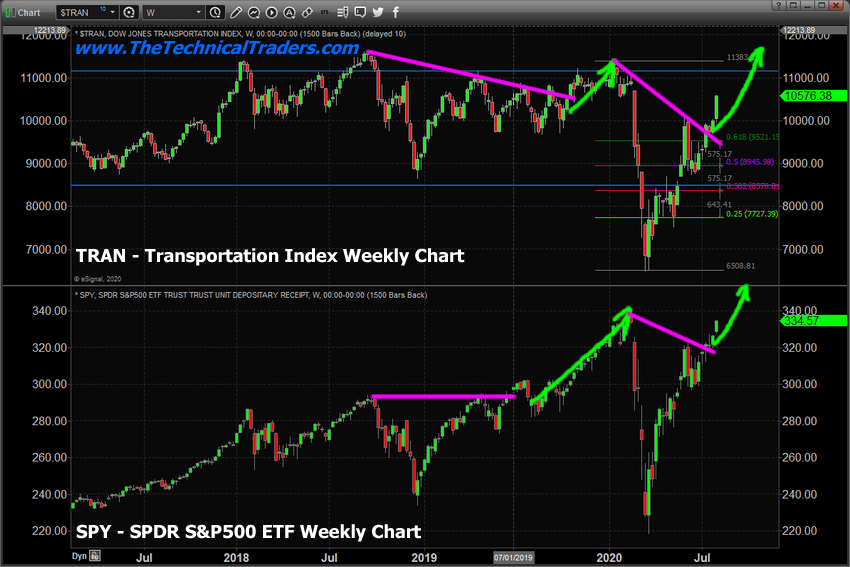
The Weekly TRAN/SPY chart below highlights similar longer-term consolidation and breakout patterns that seem to present very real opportunities for SPY traders. When the TRAN enters a longer-term consolidation period, then breaks out to the upside, there is often a larger upside move in the SPY that is likely to follow. Each of these upside price moves in the SPY seems to total $25 to $35 of upside price activity before a new peak sets up. If a similar type of price move continues from the current upside price breakout, then the upside SPY target level should be near $340 to $350 where a new peak will form. This is only $5.50 to $15.50 away from current SPY price levels (+1.75% to +4.5% higher).

We suggest traders expect a continued moderate “melt-up” after President Trump’s Executive Order actions on Saturday with very clear targets in the SPY just 2% to 4% higher. At that point, we believe the markets will enter another consolidation period and begin to move sideways. Watch metals and watch for conditions that could present greater risks. If Gold breaches $2300 or Silver breaches $37.50, then traders should really start to worry that metals are suggesting risk levels are now at critical levels.
As a technical analyst and trader since 1997, I have been through a few bull/bear market cycles in stocks and commodities. I believe I have a good pulse on the market and timing key turning points for investing and short-term swing traders. 2020 is going to be an incredible year for skilled traders. Don’t miss all the incredible moves and trade setups.
If you found this informative, then sign up now to get a pre-market video every day before the opening bell that walks you through the charts and my proprietary technical analysis of all of the major assets classes. You will also receive my easy-to-follow ETF swing trades that always include an entry price, a stop, two exit targets, as well as a recommended position sizing. Visit my Active ETF Trading Newsletter to learn more.
While many of you have trading accounts, the most important accounts are long-term investment and retirement accounts. Why? Because these accounts are, in most cases, an individual’s largest store of wealth (other than home equity) and if they are not protected during a time like this, you could lose 25-50% or more of your entire net worth in a few days. We can help you preserve and even grow your long term capital when things get ugly (like they are now) and scary (as we expect them to soon be).
If you have any type of retirement account and are looking for signals when to own equities, bonds, or cash, be sure to become a member of my Long-Term Investing Signals, which includes a weekly market update and trade alerts.
Stay healthy and rest easy at night by staying informed through our services – sign up today!
Chris Vermeulen
Chief Market Strategist
Founder of Technical Traders Ltd.

