Treasuries Pause Near Resistance Before The Next Rally
Our research team believes the US Treasuries and the US Dollar will continue to strengthen over the next 2 to 6+ weeks as foreign market and emerging market credit and debt concerns outweigh any concerns originating from the US economy or political theater. Overall, the major global economies will likely continue to see strength related to their currencies and debt instruments simply because the foreign market and emerging markets are dramatically more fragile than the more mature major global economies.
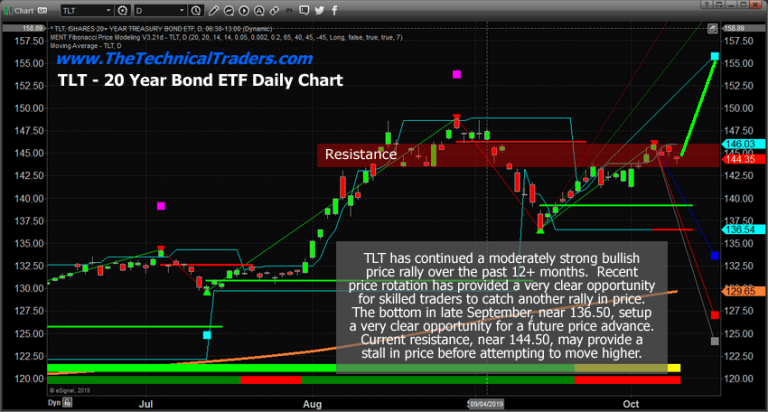
We believe the US Treasuries may surprise investors by rallying from current levels, near price resistance, to levels above $151 on the TLT chart.
Our belief is that further economic concerns related to trade, foreign economic metrics and data and the forward perspective of many emerging and foreign markets will continue to weaken much more dramatically than the US or other major global economies. Thus, we believe capital will continue to pour into the US and more mature major global economic markets (Canada, Japan, Great Britain, Swiss) as a move to safety just as capital is moving into the precious metals markets.
When fear enters the global markets, capital seeks out the safest and most secure environments for investment. If the rest of the world’s economies are becoming weaker and more fragile as trade and economic factors continue to hit the news wires, the more mature major economic countries are naturally going to benefit from their more robust and secure economic power and strength. The flight to safety will result in capital moving away from risk and into the safety of these more mature economies simply because they provide a level of security and risk aversion that can’t be found elsewhere. Make sure to opt-in to our free market trend signals newsletter.
Daily TLT Chart
This Daily TLT chart highlights the resistance level that we believe is current constricting the current price advance from breaking higher. We believe this resistance channel is causing the TLT price to pause below $147 and will continue to keep prices within this channel until some economic news event or positive US economic news item pushes the price higher. The US and global markets are waiting for some type of news event before attempting to make another move. We believe the future news will result in an upside technical breakout and a new rally towards the $152 to $155 level in TLT.

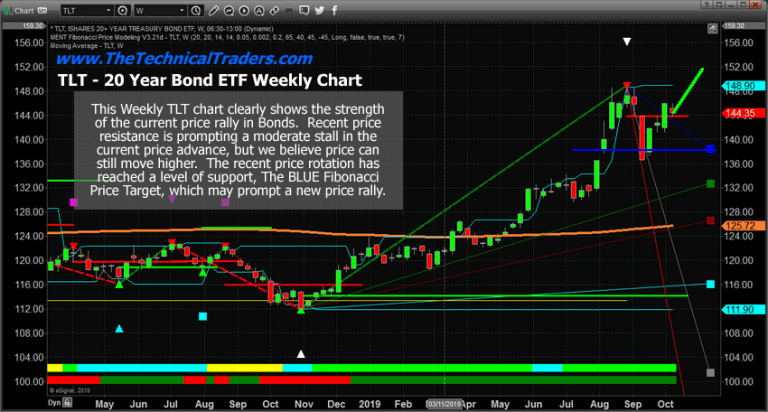
Weekly TLT Chart
This Weekly TLT chart highlights the extended bullish price rally that started back in late October 2018. This upside price move has already rallied more than 40%, but we don’t believe it is over yet. Our Fibonacci price modeling system is suggesting $154 to $155 is the next upside price target. To be a bit more conservative, we’ve targeted the $152 level for skilled traders to work with. Once price achieves the $152 target level, look to cover any open long trades you may have.
If you are an active trader of gold, gold stocks, bonds, or the SP500 and would like to hear a trading style that reduces the amount of trades you take while making the same or better returns listen to this conversion with Adam Johnson who is an x-Bloomberg anchor, and now active trader.

Understanding how pricing and global market dynamics work throughout the stock market and the global market can be confusing at times. How can one attempt to understand what will move in a certain direction, why it will move that way and how one can profit from these opportunities and be difficult for many people to grasp. We do our best to try to help you by highlighting trade setups, explaining our thinking and research, sharing some of the charts with our proprietary trading tools and to help you identify strong opportunities for success.
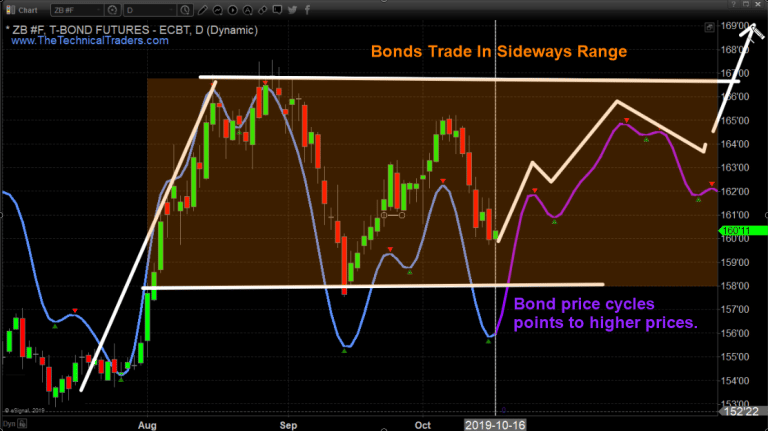
Bonds are likely to continue to trade in a sideways price range before breaking higher near the end of 2019. This aligns with our expectations that foreign markets may come under intense economic pressure while the US economy continues to provide safety for investors for the long term. The support level above 157 is critical going forward.
Daily Price Cycle Predicted Price Trend
While cycle analysis helps us paint a clear picture of what to expect looking forward up to 45 days I still rely on my market trend charts to know when I should be buying or selling positions.

The Technical Traders Concluding Thoughts:
Right now, we believe the markets are waiting for some news events to make their next move. This is the time to take very measured positions when trading. This is NOT the time to go “all-in” on some trade. Be prepared for a spike in volatility and a new price trend to establish within the next 3 to 10 trading days.
As a technical analysis and trader since 1997, I have been through a few bull/bear market cycles. I believe I have a good pulse on the market and timing key turning points for both short-term swing trading and long-term investment capital. The opportunities are massive/life-changing if handled properly.
I urge you visit my ETF Wealth Building Newsletter and if you like what I offer, join me with the 1-year subscription to lock in the lowest rate possible and ride my coattails as I navigate these financial market and build wealth while others lose nearly everything they own during the next financial crisis. Join Today to Get a Free 1oz Silver Bar with a subscription – Offer Ends This Week!
Chris Vermeulen
www.TheTechnicalTraders.com


