Traders Must Stay Optimistic Part 5 – The End
This, the final segment of our multi-part research post regarding the potential future market direction as well as to identify if there is any real concern for traders regarding a “total market collapse” as some Doomsayers are predicting should help you understand what our researchers believe is the most likely outcome. In the previous segments of this research post, we’ve covered everything from the globalization of markets and economies to key elements of core pricing levels and valuation levels of economies, equities markets and more. The data is out there if you know where to find it and how to read it. All one has to do is step back from the shorter term charts and see the bigger picture for a bit.
As promised, we’re going highlight some very informative future market predictions using our proprietary Adaptive Dynamic Learning (ADL) predictive price modeling tool. This modeling tool has been able to call the past 20+ months of market activity very accurately and help to guide us in understanding what is really taking place in the US stock market – read more about it here.
The one key element of the ADL predictive modeling system is that it accomplishes two key components. First, it can provide a very clear “high probability” outcome for nearly any market in any time-frame. Second, it can also provide us with a very clear “point of failure” with regards to the predictive modeling results. We’re certain you understand the value of the first component, but do you understand the value of “knowing when you’re wrong”?
The concept of “failure to fail” or “failure to succeed” continues to baffle many traders, investors, and researchers. If you break it down into the simplest terms, it means “you are absolutely correct” or “you are dead wrong”. The question then becomes, “do you have a plan of action for both of these potential outcomes?”. Keep this in mind as we continue reviewing charts.
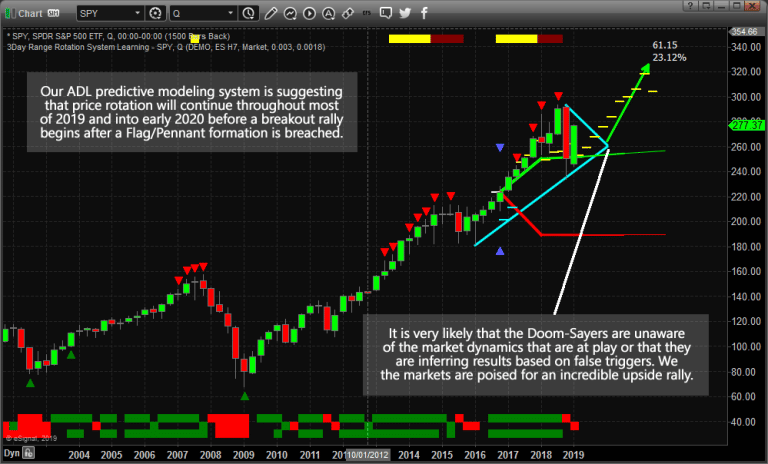
This first QUARTERLY SPY chart highlights our ADL predictive modeling system results originating from October 2016. The ADL predictive modeling system plots the highest probability outcome for price based on a very unique “price pattern and technical indicator DNA marker/lookup” algorithm. What makes it so unique is that it is able to learn from any price data and apply that data/outcome to any newer price par that appears on the chart. Thus, we can ask the ADL to show us what is likely to happen well into the future with a relatively high degree of accuracy.
In this case, if you follow the YELLOW, WHITE and CYAN dash levels on this chart, you’ll see the predicted outcome from the ADL price modeling system matched real price levels quite accurately and actually predicted the Q4 2018 market collapse very accurately. You can read about how we called this market move here.
Currently, the ADL predictive price modeling system is suggesting the current price of the SPY is well above projected ADL price levels. Thus, we would be expecting the price to rotate lower over the next few weeks/months to settle near the 250~270 level. You should be
able to clearly see the YELLOW dash levels to the right of the current price – these are the ADL predictive price levels going forward. Our research team believes the US and global markets will enter a Pennant/Flag formation over the next few months before setting up for another massive upside breakout. More detail about this setup can be read here.
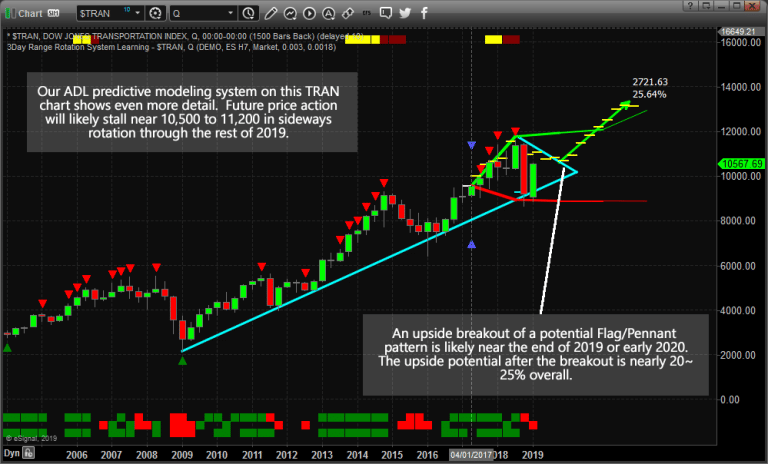
This QUARTERLY TRAN chart shows a similar setup, yet there is one key difference between these two charts. This TRAN chart shows that price is currently below the predicted ADL price levels and we can see the ADL predicted price levels trade near 10,750 to 11,200 levels over the next 4 to 5 quarters. This would likely result in an upward price bias, from these current levels, with a very strong possibility of a sideways, volatile Pennant/Flag formation setting up over the next 6~10+ months. Somewhere near Q1 or Q2 of 2020, the ADL predictive modeling system is suggesting that TRAN prices will begin a new upside price rally that may result in a +20% to +30% upside target.
By showing you these two predictive modeling charts and the results of our advanced, proprietary ADL predictive modeling system, we hope we have been able to help to settle your nerves going forward and to help to prove to you that 2019 and 2020 will be incredible years for skilled traders. All we have to do is understand what price and other technical data are showing us and then sit back and wait for the shorter term price triggers to generate strategic entry triggers.
In order to properly answer our initial question that set us off on this quest: “Are the Doomsayers correct in their predictions or are our predictive analysis models correct in their predictions?” – the true answer is that the future will prove one of us right and one of us wrong. We believe in our predictive modeling system because it has been able to call the past 20+ months of trading accurately and we’ve seen the power of this tool first hand – many of you have as well.
Overall, yes there are risks still within the global markets and they are still in the midst of a very fragile “revaluation phase” that could include unknown risks for all traders. Additionally, the ADL predictive modeling system does not take into account geopolitical events (war, regional power struggles, famine or “acts of God”). It just shows us what it believes is the highest probability outcome in the future. Therefore, we suggest all traders/investors continue to stay “cautiously optimistic” going forward and learn to exercise proper risk controls.
The global market data that we’ve presented within this multi-part article should help to paint a very clear picture of what is really happening throughout the planet at the moment – at least we hope it does. We want all of our followers and friends to understand the risks and opportunities that are currently ahead of us and we want to make sure you understand just how important good skilled research is to make informed decisions.
If you like this type of research and how we present these details, then please take a minute to visit www.TheTechnicalTraders.com to learn how you can benefit from the hard work our research team puts forth to provide our members with clear opportunities for success. Take a look at some of our recent winners to see how we help people, just like you, create success. We believe 2019 and 2020 will be incredible years for skilled traders and we are executing at the highest level we can to assist our members. In fact, we are about to launch our newest technology solution to better assist our members in creating future success. Isn’t it time you invested in your future success by joining a team of professionals dedicated to giving you an advantage in the markets every day?
We still take trades just like the rest of the planet’s traders – we measure risk and opportunity and make decisions to “take the trade” or not. The only difference is that we have some very cool, proprietary modeling systems that help us find and execute these trading decisions. Visit www.TheTechnicalTraders.com to learn how you can become a member today.
Chris Vermeulen
Technical Traders Ltd.
www.TheTechnicalTraders.com


