Index Prediction System Is Telling Us A Very Different Story
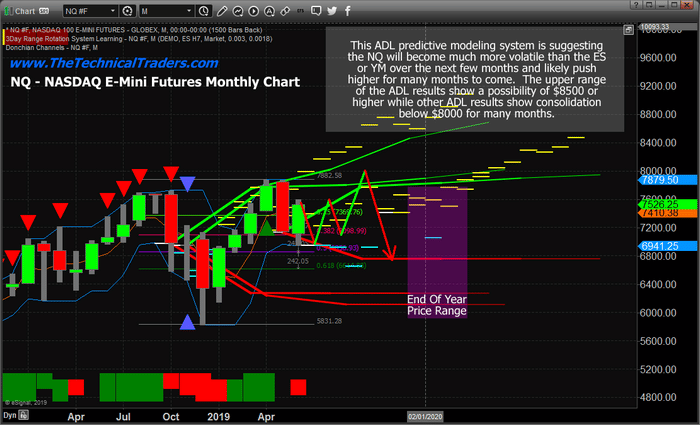
On this day, celebrating fathers and all they do for families and their children, we thought we would share some really interesting research regarding the next six months trading expectations in the NASDAQ and what it means for your trading account. One element of our research involves data mining and searching for historical price correlation models. These types of elements help us identify when the price is acting normally or abnormally.
We like to focus on the NQ (NASDAQ) because its tech-heavy and is where a lot of the Capital Shift (money from other countries is flowing into as a safe/best asset class at this time).
Below, We are going to Geek-Out a little and sharing raw data values from one of our data mining utilities highlighting each month’s historical activity in the NQ.
Pay close attention to the “Total Monthly Sum” and the monthly NEG (negative) and POS (positive) values. These values show the range of price activity over the past 20 years normalized for each month. Obviously, we can’t expect the markets to adhere to these normalized values, but we can gain insight from the data retrieved by this data mining tool.

To help you understand this data we’ll focus some brief analysis on the month of June, below. June has a total monthly NEG value of -1009 and a total monthly POS value of 1410. Additionally, the NEG value is comprised of 9 months of data and the POS value is composed of 11 months of data. Therefore, the relationship between NEG and POS months is roughly 1:1 – or about equal. Overall, the positive months outweigh the negative months by 401 points. The largest monthly positive and negative values are 492 and -189. This suggests the positive price aspect of these mined data points is about 2.3:1 respectively.
The conclusion we derive from this date is that June is moderately more positive based on historical price data then negative. This data is derived from the NQ. Therefore the expectations of a positive 300 to 400 point move in the NQ for June would be in line with historical expectations. Anything beyond that range should be considered a price anomaly. These types of price anomalies to happen fairly often but are difficult to predict.
As of today, the NQ has already moved upward by over 400 points since the end of May. This price advance equaling our expected data range would suggest that the upward price move in the NQ may be very close to ending.
=====[ June Monthly Analysis ]========================
– Largest Monthly POS : 492 NEG -189.25
– Total Monthly NEG : -1009 across 9 bars – Avg = -112.11
– Total Monthly POS : 1410 across 11 bars – Avg = 128.18
——————————————–
– Total Monthly Sum : 401 across 20 bars
Analysis for the month = 6
===================================================
As you scan through the rest of these data mining results, pay very close attention to the largest monthly ranges as well as the overall price bias described by the total monthly NEG and POS values. For example, in July the monthly values are more narrow in range. Yet the total monthly NEG and POS values depict a broader range for price.
Additionally, the POS bars (13) compared to the NEG bars (6) describes a vastly different historical price relevance. The possibility of an upside price bias in July is much stronger than what we determined four June. The 13:6 ratio of upside to downside price bars in July converts into a nearly 2:1 upside price expectation versus a 1:1 ratio in June. Because of this, we can determine that July will likely result in a positive upside price move of at least 150 to 250 points in the NQ before exhausting.
=====[ July Monthly Analysis ]========================
– Largest Monthly POS : 319.75 NEG -200
– Total Monthly NEG : -656 across 6 bars – Avg = -109.33
– Total Monthly POS : 1654 across 13 bars – Avg = 127.23
——————————————–
– Total Monthly Sum : 998 across 19 bars
Analysis for the month = 7
===================================================
Our data mining tool suggests that August may be much more volatile than July. The larger monthly total sum suggests a possible breakout move to the upside. The increases in total monthly values suggest volatility will also increase. Overall the combined July and August data points suggest rotation may end with a big move to the upside sometime in late August before a correction.
=====[ August Monthly Analysis ]========================
– Largest Monthly POS : 477 NEG -313.25
– Total Monthly NEG : -835.5 across 8 bars – Avg = -104.44
– Total Monthly POS : 1702.5 across 12 bars – Avg = 141.88
——————————————–
– Total Monthly Sum : 867 across 20 bars
Analysis for the month = 8
===================================================
September data points show an immediate reversal to the upside price bias. The data reporting from our data mining tool flips to the negative side fairly strong. Overall expectations are roughly 1:1 that a downside price move will dominate for September.
Our data mining utility suggests a downside price move of between -450 and -550 points. If you’ve been following our research, you already know that we are predicting a moderately large downside reversal beginning in late August or September. It is our belief that the US stock markets will rotate downwards after a peak in price in August. We believe this downside move could last well into November, much like the downside move in 2018.
=====[ September Monthly Analysis ]========================
– Largest Monthly POS : 229 NEG -473
– Total Monthly NEG : -1460.25 across 10 bars – Avg = -146.03
– Total Monthly POS : 903.5 across 10 bars – Avg = 90.35
——————————————–
– Total Monthly Sum : -556.75 across 20 bars
Analysis for the month = 9
===================================================
Should our expectations play out in the market, the downside price move in September, October and possibly November, would result in a unique price anomaly setup near this price bottom.
As you can see from the data mining results, below, the last quarter (3 months) of the year typically results in upside price bias. Therefore, any deep downside price move after our expected peak in August will set up a very unique price anomaly pattern where skilled traders should be able to capture an incredible upside price run near the end of 2019.
=====[ October Monthly Analysis ]========================
– Largest Monthly POS : 480.25 NEG -679.75
– Total Monthly NEG : -1564.5 across 7 bars – Avg = -223.50
– Total Monthly POS : 2320.25 across 13 bars – Avg = 178.48
——————————————–
– Total Monthly Sum : 755.75 across 20 bars
Analysis for the month = 10
===================================================
=====[ November Monthly Analysis ]========================
– Largest Monthly POS : 316.5 NEG -768
– Total Monthly NEG : -1169 across 6 bars – Avg = -194.83
– Total Monthly POS : 1509 across 14 bars – Avg = 107.79
——————————————–
– Total Monthly Sum : 340 across 20 bars
Analysis for the month = 11
===================================================
Pay very close attention to the fact that December can be fairly mixed in terms of overall price bias and upside or downside price expectation. With a 1:1 (equal price weighting) for both positive and negative price results and a monthly sum of only about 100 points, we would expect December to be moderately congested and flat.
=====[ December Monthly Analysis ]========================
– Largest Monthly POS : 782 NEG -616.25
– Total Monthly NEG : -1179.5 across 10 bars – Avg = -117.95
– Total Monthly POS : 1291.5 across 10 bars – Avg = 129.15
——————————————–
– Total Monthly Sum : 112 across 20 bars
Analysis for the month = 12
===================================================
And there you have it, our Father’s Day gift to all of you. These results from our proprietary data mining utility are providing you with a detailed map of what to expect in the NQ going forward through December 2019. This is only one aspect of our research team’s resources and unique capabilities that assist us in understanding what price will be doing in the future. There are many other utilities and trading indicator tools that we use to help confirm and validate our analysis.
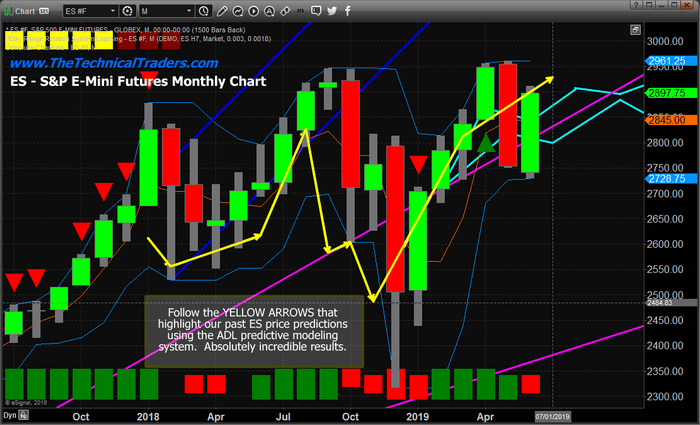
We’ve included a chart of the S&P E-mini futures contract with a yellow line drawn across our predicted price modeling expectations starting from the end of 2017 until now. Pay very close attention to our expected price levels and the market price levels as time progressed forward. As you become more skilled in understanding how this data can be used to benefit your trading and deliver results, you’ll learn why our research team relies on our proprietary modeling tools and software so heavily.

We thought we might share a bit of specialized data with you on this Father’s Day so that you could use some of our proprietary information in your own research and analysis going forward.
Please remember, price action dictates everything. Even though we can model and data mine incredible information months or years into the future, everything comes down to what price is doing right now. If it confirms our analysis, then fantastic – our research may be right on the money. If the price moves beyond our expectations and research, then we have to reevaluate our expectations in correlation with the data that we have to determine if we need to adjust our expectations going forward.
My point is, yes we can forecast, yes we have been correctly more times than not, but you cannot just go out and place trades based on this analysis alone because our analysis will change with the market.
To be blatantly honest, we don’t really care what the market does or when. We FOLLOW the market and trade on its coat tales, we don’t jump in front of it and guess/hope it will reverse as we are predicting.
Some of our articles/forecasts we share simply don’t happen and we get lots of flack from free followers of these articles. But what most followers fail to understand is that even when our predictions are DEAD WRONG, we and our subscribers make money in most cases. Again, we don’t trade the forecasts we just let them help guide us, and we trade with the dominant trend.
We have a good pulse on the major markets and can profit during times when most others can’t which is why you should join my Wealth Trading Newsletter for index, metals, and energy trade alerts.
I can tell you that huge moves are about to start unfolding not only in metals, or stocks but globally and some of these super cycles are going to last years. These super cycles starting to take place will go into 2020 and beyond which we lay out in our new PDF guide: 2020 Cycles – The Greatest Opportunity Of Your Lifetime
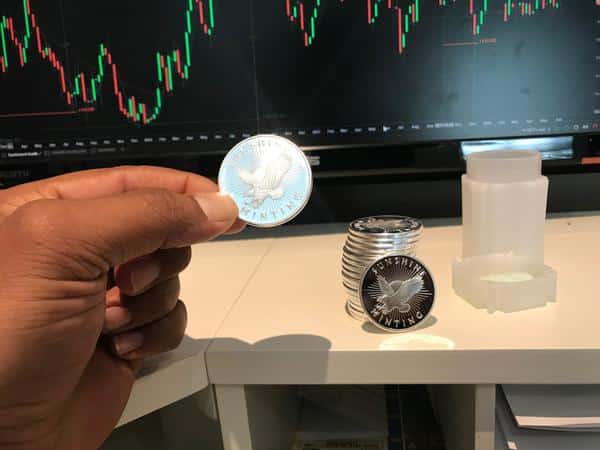
I am going to give away and ship out silver rounds to anyone who buys a 1-year, or 2-year subscription to my Wealth Trading Newsletter. You can upgrade to this longer-term subscription or if you are new, join one of these two plans listed below, and you will receive:

1-Year Subscription Gets One 1oz Silver Round FREE
(Could be worth hundreds of dollars)
2-Year Subscription Gets TWO 1oz Silver Rounds FREE
(Could be worth a lot in the future)
SUBSCRIBE TO MY TRADE ALERTS AND
GET YOUR FREE SILVER ROUNDS!
Free Shipping!
Happy Fathers Day Guys!
Chris Vermeulen
Founder of Technical Traders Ltd.

