February 2020 COVID Breakdown Gap Acting As Support For Rally
The difference in the price setup of the initial February COVID-19 downside price gap on the INDU (Dow Jones Industrial Average) vs. the SPY (SPDR S&P500 ETF) clearly shows how this previous gap in price is acting as a critical support level for the current price rally. When the downside price gap first started, near February 25th, 2020, technical traders immediately identified this “impulse gap” as an important price structure to watch in the future. As the US stock markets recovered in late August/September, price levels began to attempt to “fill the gap” on the INDU chart. On the SPY chart in August/September, prices filled the gap then rallied to new highs – initiating a new upside price rally attempt.
My team and I believe these gap levels on the INDU and SPY currently represent a critical horizontal support level for both the INDU and the SPY. This gap range is now acting like a “hard floor” in price that should be watched by all traders. We will examine these setups on the charts below.
INDU WEEKLY HARD SUPPORT FLOOR SETUP
The Weekly INDU chart, below, highlights the gap range with a shaded GOLD rectangle. You should be able to clearly see the multiple peaks in late August 2020 and early October 2020 that confirmed this gap range was acting as resistance. Then, just after the US elections, the INDU price gapped higher, above the GOLD gap range, and began to rally. This breakout upside gap in price changed the GOLD gap range from resistance to support. My research team believes the GOLD gap range has now become a solid hard floor support level between 28,400 and 28,850.
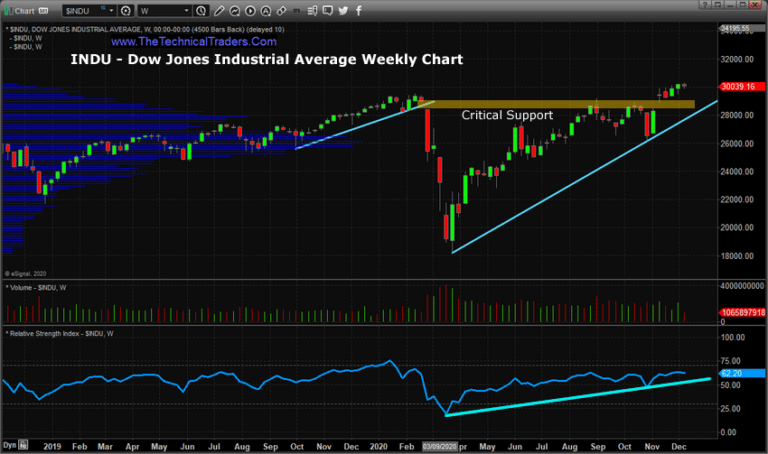
As long as price continues to rally above this level and fails to breakdown below this range, then the bullish price trend should continue. This prior gap range has become a critical level in price structure going forward. What was resistance has now become major support.
Be sure to sign up for our free market trend analysis and signals now so you don’t miss our next special report!
We have also highlighted the RSI trends, near the bottom of these charts, to show you how defined the uptrend is in relationship to moderate market rotation. Other than the early November dip in the RSI, the continued upside strength we’ve seen since April 2020 has shown very little real rotation in price. Now that we’ve cleared the “all-time high” benchmark again, we expect to see some broader market price rotation in the future – which is why the gap range critical support level becomes important.
SPY WEEKLY HARD SUPPORT FLOOR SETUP
A similar price pattern has set up on the SPY, although with slight differences in price structure. The initial downside price gap from the COVID-19 collapse set up a very clear initial gap, highlighted again with a shaded GOLD rectangle on the chart below. This downside price gap created an immediate resistance zone as price continued to decline. While price recovered, we can see how price moved above the gap range in August 2020, then began to rotate sideways. Throughout this span of about 90 days, the gap range was retested twice, in September and October – reconfirming the gap range level was acting as strong support.
What we find interesting is that the SPY chart shows price levels had already cleared the gap range and started confirming the critical support level well before the INDU price level attempted to move above the gap range. This suggests the broader S&P500 presented a stronger upside price bias than the INDU – as the S&P includes 500 symbols and the Dow Jones include only 30 symbols.
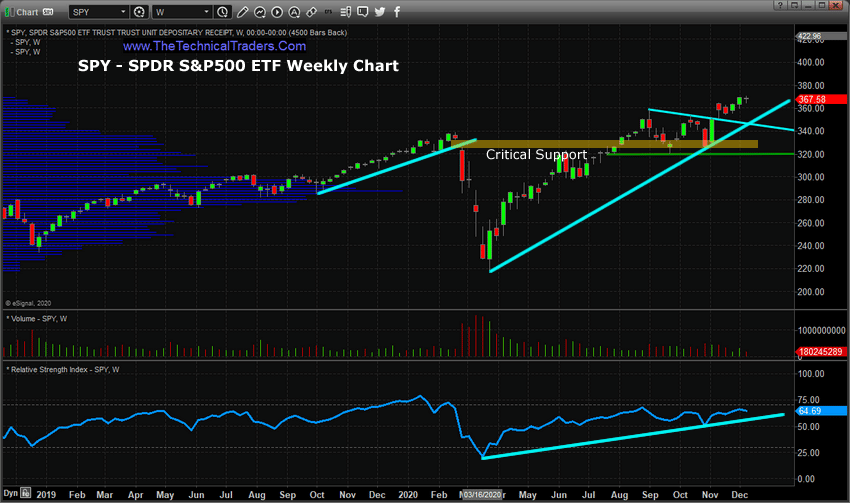
At this point, the SPY has rallied a little over 10.4% above the upper level of the gap range whereas the INDU has only rallied about 4.25% above the gap range. If a broad market bullish trend continues, the SPY may outperform the INDU by a 2:1 ratio if the current price ratio continues.
In closing, it is important to understand how these gaps work as critical targets as well as critical support and resistance levels. Right now, these gap ranges are acting as a very important hard support floor for price. As long as price does not breach these levels, expect the bullish trend to continue.
As we move closer to closing out 2020, traders should prepare for increased volatility in 2021 and the potential for broader market trends. 2021 looks to be a traders market in our opinion. Our research continues to show owning the best-performing assets while avoiding risks is key to long-term success. Visit www.TheTechnicalTraders.com to learn how our Best Asset Now strategy is essential for traders/investors that want to attempt to outperform the markets.
Happy trading!!
Chris Vermeulen
Chief Market Strategist
www.TheTechnicalTraders.com
NOTICE AND DISCLAIMER: Our free research does not constitute a trade recommendation or solicitation for readers to take any action regarding this research. We are not registered financial advisors and provide our research for educational and informational purposes only. Read our FULL DISCLAIMER here.