Stock Market Setting Up For A Bigger Pullback – Part II
If you didn’t read Part I already click here to quickly read it first.
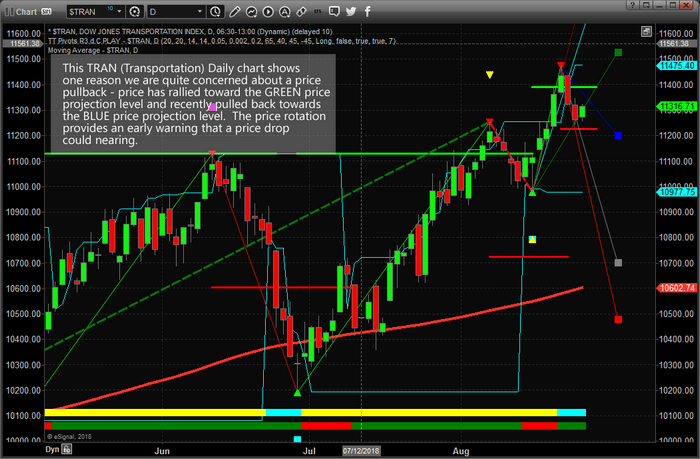
This Daily Transportation chart shows a more detailed view of price rotation, recently, and shows how our Fibonacci price modeling system assists us in understanding price rotation on different intervals. We can ask our Fibonacci system to show us all types of support and resistance levels on any time-frame or chart. We focus on the Daily and Weekly charts because these tend to be key levels supported by the broader markets.
In this case, the TRAN chart is showing us that resistance is near 11,525 and support is near 11,200. Current price rotation is illustrating that price has weakened near resistance and showing moderate strength near support. Although we believe the potential for a downside move is growing, the price will be the ultimate determination of the outcome. If price holds and rallies in the Transportation Index from these levels, then the possibility of our expected pullback diminishes. If the Transportation index falls below the 11,200 support level, then we would have greater confidence that our expected pullback is happening and advise our clients to pull and protect all long positions. Right now, we are waiting for the price to tell us what to expect and we believe the downside move is the most likely outcome.
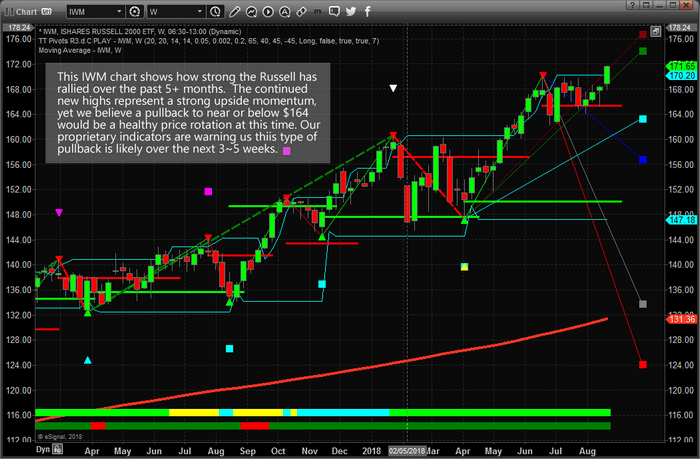
The Russell 2000 has been one of the best performing sectors of the US markets over the past few months. The continued upside rally in this sector has been incredible for long traders. And, obviously, the downside risk of a price pullback is equally as incredible. Based on our Fibonacci price modeling system, the downside support levels are 163.50 (-4.5%), 154.30 (-10%) and 153 (-11%). This Weekly chart shows us that we have rallied past the CYAN projected price level and are nearing the extended GREEN projected price level. This type of extended price rally can continue for quite a while, but we believe the confluence factors of all of these charts and analysis modeling is pointing towards a much bigger potential for a price pullback before any extension of a renewed rally takes place.
If you want to learn more about our research, services and how we can help you find and execute better trades, then please visit www.TheTechnicalTraders.com to learn about our team of researchers and products for traders. You can also review all of our past research posts to learn how we have been calling these market moves for the past 12+ months. We urge you to pay attention to our work because we believe we have some of the most advanced and accurate market timing tools on the planet. Time will tell if we are correct with Today’s call – bet we want you to understand the risks and potential rewards that are presented right now in the markets. Take a minute to see how we can help you become a better trader as these moves play out over the next 12+ months.