Inverse Energy ETF AT Breakout Level – Could Rally Further
Following up on an exciting article we shared with friends and followers on January 17, 2020, it appears ERY has reached the first stage for profit taking with a fairly strong potential we may see this rally continue even higher. Please review the following repost of our original research and analysis of ERY back in early January.
January 17, 2020: ENERGY CONTINUES BASING SETUP – BREAKOUT EXPECTED NEAR JANUARY 24TH
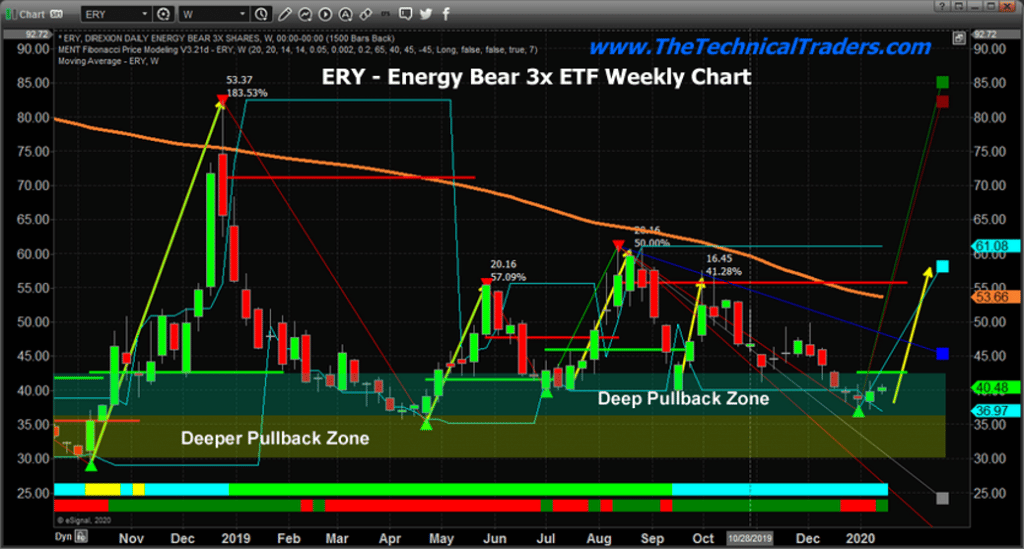
ERY Bear Energy ETF – Weekly Chart
At the time we authored this ERY article, our team of dedicated researchers believed that Oil would retrace from recent highs near $65 and continue to move lower – targeting the low $50 to mid $40 price level. Our expectations were that a move in ERY from near $39~$42 to an initial target level near $55~$57 would be an excellent opportunity if Oil broke lower. You can see the CYAN Fibonacci projected target level that aligns with our original target price level on this chart below.

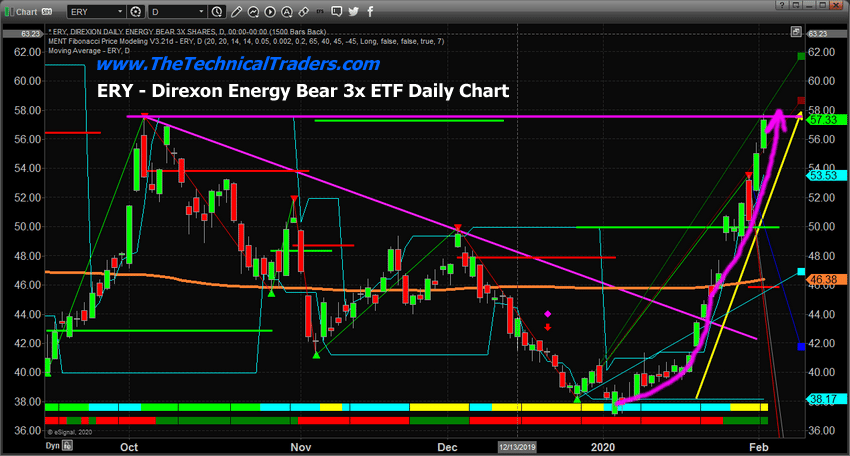
ERY Bear Energy ETF – Daily Chart
Currently, we believe this current target level has been successful and urge any friends and followers to pull at least 50% of your profits at this current level. If you decide to allow the rest of your position to continue, stops should be moved to levels near or below $52. We believe the continued upside potential for this trade is still valid with a secondary target above $67~$75. Trail your stop with every new weekly high and look to start exiting this trade on any price tick above $67 or $72.

ERY Bear Energy ETF – Weekly Chart
Some resistance may be seen between $56 and $61. There are historical price peaks near these levels that may act as a price boundary throughout this rally. Once the $64 to $65 level is breached, ERY should continue to rally higher is Oil and Natural Gas continue to weaken. Remember, trail your protective stop higher with each new Weekly high.

We are pleased to deliver another incredible trade setup found by our team of dedicated researchers. Nothing like finding a trade that rallied from $40.50 to 57.33 (+41%) and may continue much higher.
Please take a minute to visit www.TheTechnicalTraders.com to learn about our dedicated services for skilled traders and how we can help you find and execute better trades. 2020 is certain to be filled with extreme volatility and price rotation. You might as well take advantage of our research and services to create greater opportunities for profits and trades.
Chris Vermeulen
Founder of Technical Traders Ltd.


